YouTube Benchmarks 2026: Views, Engagement, Growth & Subscriber Data From 6 Studies
What is a good YouTube view count?
What engagement rate should you aim for?
How many views should a video have after seven days?
What percentage of your subscribers should watch?
How fast should a healthy channel grow?
Search for any of those questions and you will find a benchmark.
The problem is that most YouTube benchmarks are treated as universal when they are actually measuring different:
- channel sizes
- video formats
- video ages
- formulas
- audiences
- research samples
A 5% views-to-subscriber ratio can look weak for one channel and completely normal for another.
A 5% engagement rate can be strong.
A 5% monthly subscriber growth rate can be modest for a tiny breakout channel and enormous for an established million-subscriber creator.
And a video with:
100,000 views
can be either:
- a major breakout
- normal
- or a severe underperformer
depending on what that channel normally achieves.
So instead of publishing another universal "good YouTube metrics" chart, OverseerOS combined findings from six of our public-data studies into one benchmark framework.
The underlying research includes:
- 2,580 mature long-form videos for average-vs-typical view performance
- 2,043 recent videos for views-to-subscriber ratios
- 2,251 recent videos for engagement benchmarks
- 436 long-form uploads measured around day 7
- 1,051 long-form uploads measured around day 30
- 1,035 long-form uploads measured around day 90 in the latest cohort
- 89 repeatedly observed channels for subscriber-growth analysis
These samples overlap in places and should not be added together as one giant unique-video dataset.
They answer different questions.
Taken together, however, they reveal one consistent rule:
The most useful YouTube benchmark is not one platform-wide number. It is a benchmark matched to the video's age, format, channel size, and the channel's own recent baseline.
This report gives you those reference points.
Key YouTube Benchmarks for 2026
Here are the headline findings.
| Metric | OverseerOS benchmark |
|---|---|
| Typical mature long-form video's mean vs median distortion | Mean was 1.97x the median |
| Mature long-form top 10% share of channel views | 48.7% |
| Recent long-form views-to-subscriber ratio | 11.9% channel-weighted median |
| Recent short-form views-to-subscriber ratio | 21.7% channel-weighted median |
| Recent long-form engagement rate | 3.48% median |
| Recent short-form engagement rate | 2.71% median |
| Strong public engagement benchmark | Around 5% |
| Long-form top-decile engagement | 7.26% |
| Short-form top-decile engagement | 6.67% |
| 7-day long-form pooled median | 28,604 views |
| 30-day long-form pooled median | 27,831 views |
| 90-day long-form pooled median | 45,608 views |
| Monthly-equivalent subscriber growth, selected tracked cohort | 3.10% median |
| Subscriber size vs percentage growth | -0.683 Spearman |
| Subscriber growth vs public view growth | 0.826 Spearman |
Do not read the 7-day, 30-day, and 90-day medians as one video's growth curve.
They come from different cohorts.
A video cannot lose views from day 7 to day 30, but a separate day-30 sample can have a lower median because it contains different channels and videos.
That distinction is critical.
The Direct Answer: What Are Good YouTube Benchmarks?
The strongest benchmarks our research supports are:
Typical video performance
Use the median of your own comparable videos, not the arithmetic average.
Strong long-form engagement
Around:
5% likes + comments per view
was approximately top-quartile performance in our recent sample.
Exceptional long-form engagement
Around:
7.3%
placed a channel near the top decile.
Recent long-form views relative to subscribers
Our channel-weighted median was:
11.9%.
But channel size changed this dramatically.
Seven-day views
Use a channel-size benchmark for external context, then compare against your own same-age baseline.
30-day views
Same rule.
90-day views
Same rule.
Subscriber growth
There is no universal good monthly percentage because growth rates naturally change as channels get larger.
The benchmark hierarchy should be:
your channel → same format → same video age → similar channel size → broad external benchmark
Not the reverse.
Benchmark 1: Use Median Views, Not Average Views
This is the most important baseline rule.
OverseerOS analyzed:
2,580 mature long-form videos across 67 channels.
We compared each channel's:
- arithmetic mean views
- median views
The median channel had a mean that was:
1.97x its median.
In other words:
The statistic most creators call "average views" was almost twice what the typical video actually achieved.
Why?
Because YouTube performance was heavily concentrated in a small number of winners.
On the median channel:
- top single video generated 19.6% of qualifying views
- top 10% generated 48.7%
- top 20% generated 64.6%
That makes the arithmetic mean extremely sensitive to viral videos.
Example
Suppose your videos get:
- 8K
- 9K
- 10K
- 11K
- 112K
Mean:
30K
Median:
10K
If you tell yourself:
My average is 30K, so my next video should get 30K
you have created an unrealistic baseline.
Most of the channel's uploads do not get 30K.
The winner inflated the number.
Mature Long-Form Performance Multiples
In that 2,580-video study, the median channel had these thresholds:
| Position within channel distribution | Views vs channel median |
|---|---|
| Typical video | 1.00x |
| Top quartile | 2.14x |
| Top 20% | 2.59x |
| Top 10% | 4.62x |
| Top 5% | 7.33x |
These are descriptive reference points, not YouTube algorithm thresholds.
Still, they provide a much stronger vocabulary than:
good views
or:
bad views.
If your channel median is:
20,000
then:
92,400 views
would equal:
4.62x baseline.
That is much more strategically meaningful than saying:
It got 92K views.
For the full analysis, see What Is a Good Average View Count on YouTube?.
Benchmark 2: YouTube Views-to-Subscriber Ratio
One of the most common creator benchmarks is:
What percentage of my subscribers should watch each video?
The problem is that video views are not restricted to subscribers.
A video can reach:
- subscribers
- returning non-subscribers
- Search viewers
- Browse viewers
- Suggested viewers
- entirely new audiences
So the public views-to-subscriber ratio is better understood as:
video reach relative to channel subscriber size
not:
percentage of subscribers who watched.
Overall Recent Benchmark
OverseerOS analyzed:
2,043 videos across 273 channels
measured when the videos were:
7 to 30 days old.
Channel-weighted median:
Long-form
11.9%
Short-form, 3 minutes or less
21.7%
But those pooled numbers hide the most important result.
Channel size changed the ratio dramatically.
Long-Form Views-to-Subscriber Benchmarks by Channel Size
| Channel size | Channel-weighted median |
|---|---|
| Under 10K | 170.7% |
| 10K to 99K | 36.2% |
| 100K to 999K | 11.3% |
| 1M+ | 5.2% |
The under-10K figure was extremely volatile and should not become a target.
The middle 50% in that group ranged from:
52.4% to 400.9%.
That instability is exactly why small channels should not obsess over one views-to-subscriber percentage.
Why a 5% Ratio Can Be Fine
Imagine:
Channel A
30K subscribers
1,500 recent views
Ratio:
5%
Channel B
3M subscribers
150K recent views
Ratio:
5%
Same arithmetic.
Different competitive context.
In our sample, a 5% long-form ratio was far below the median for 10K to 99K channels but close to the:
5.2%
median among 1M+ channels.
A universal benchmark would diagnose both channels the same way.
The data says that is too simplistic.
Read the complete study at YouTube Views-to-Subscriber Ratio.
Benchmark 3: YouTube Engagement Rate
For public-data research, OverseerOS defines visible engagement rate as:
(likes + comments) ÷ views × 100
We analyzed:
2,251 recent videos across 309 channels
measured between:
7 and 30 days old.
Long-Form Engagement Benchmarks
| Position | Engagement rate |
|---|---|
| Bottom quartile boundary | 2.22% |
| Median | 3.48% |
| Top quartile | 4.91% |
| Top 10% | 7.26% |
Short-Form Engagement Benchmarks
| Position | Engagement rate |
|---|---|
| Bottom quartile boundary | 1.14% |
| Median | 2.71% |
| Top quartile | 4.55% |
| Top 10% | 6.67% |
The useful shorthand from this sample is:
Around 3% to 4% was typical, around 5% was strong, and around 7% sat near the top decile.
But this metric needs context too.
Engagement Does Not Automatically Fall With Channel Size
Our long-form median engagement rates were:
- Under 10K: 3.41%
- 10K to 99K: 3.44%
- 100K to 999K: 3.66%
- 1M+: 3.33%
That pattern was surprisingly stable.
Subscriber size barely explained long-form engagement rate in this particular sample.
That makes engagement different from views-to-subscriber ratio, where channel size mattered enormously.
Different metrics behave differently.
That is why one generic "channel health score" can be misleading.
For full methodology, see What Is a Good YouTube Engagement Rate?.
Benchmark 4: Like Rate
Engagement becomes easier to diagnose when separated into components.
For recent long-form videos:
Median public like rate:
3.11%.
That equals roughly:
31 likes per 1,000 views.
For short-form videos of 3 minutes or less:
Median:
2.60%.
Approximately:
26 likes per 1,000 views.
Do not interpret that as a recommendation threshold.
There is no evidence that crossing:
3% likes
automatically unlocks distribution.
Use it as a descriptive audience-response benchmark.
Benchmark 5: Comment Rate
Comments require more effort than likes.
So the rate was dramatically smaller.
Long-form median
0.238%
That equals approximately:
2.38 comments per 1,000 views.
Short-form median
0.032%
Approximately:
0.32 comments per 1,000 views.
That is why comparing comment rate with like rate directly is rarely useful.
They measure different levels of effort.
Benchmark 6: Views After 7 Days
OverseerOS tracked:
436 recent long-form uploads across 232 channels
as close as possible to day 7.
Median measurement age:
6.96 days.
Overall pooled median:
28,604 views.
But the channel-size breakdown is much more useful.
| Channel size | P25 | Median | P75 | P90 |
|---|---|---|---|---|
| Under 1K | 4 | 40 | 132 | 418 |
| 1K to 9.9K | 604 | 5,840 | 28,795 | 82,253 |
| 10K to 99K | 4,666 | 11,381 | 41,684 | 76,041 |
| 100K to 999K | 12,880 | 36,175 | 139,144 | 333,886 |
| 1M+ | 47,008 | 254,270 | 615,772 | 2.25M |
The ranges are huge.
For 1K to 9.9K channels:
P25:
604
P75:
28,795
That is nearly a:
48x spread.
So even "same subscriber tier" is not enough to create a precise expectation.
Seven-Day Views Relative to Subscribers
| Channel size | Median 7-day views / subscribers |
|---|---|
| Under 1K | 76.5% |
| 1K to 9.9K | 147.9% |
| 10K to 99K | 38.8% |
| 100K to 999K | 19.3% |
| 1M+ | 2.66% |
The small-channel numbers are particularly unstable because the denominator is tiny.
That does not make them useless.
It means you should treat them as:
context
not:
targets.
Read the full 7-Day YouTube View Benchmark Study.
Benchmark 7: Views After 30 Days
A separate OverseerOS cohort analyzed:
1,051 long-form uploads across 486 channels
measured between:
28 and 32 days after publication.
Median measurement age:
29.92 days.
Overall pooled median:
27,831 views.
Again, do not compare this pooled number directly with the separate 7-day sample as though they are the same videos.
30-Day View Benchmarks by Channel Size
| Channel size | P25 | Median | P75 | P90 |
|---|---|---|---|---|
| Under 1K | 14 | 45 | 157 | 344 |
| 1K to 9.9K | 366 | 5,428 | 28,181 | 118,596 |
| 10K to 99K | 3,950 | 11,582 | 55,231 | 173,772 |
| 100K to 999K | 8,128 | 29,255 | 134,665 | 421,597 |
| 1M+ | 63,847 | 292,667 | 1.16M | 3.71M |
One thing should be obvious from every row:
variance remains massive.
A million-subscriber channel at the 90th percentile had:
3.71 million views
versus:
63,847
at P25.
Same broad subscriber tier.
Almost:
58x difference.
Read the complete 30-Day YouTube View Benchmark Study.
Benchmark 8: Views After 90 Days
Our latest approximately 90-day long-form cohort contained:
1,035 videos across 404 channels.
Median observation age:
89.82 days.
Overall distribution:
| Percentile | 90-day views |
|---|---|
| P10 | 910 |
| P25 | 5,802 |
| Median | 45,608 |
| P75 | 232,642 |
| P90 | 891,026 |
90-Day Benchmarks by Channel Size
| Channel size | P25 | Median | P75 | P90 |
|---|---|---|---|---|
| Under 1K | 40 | 67 | 232 | 688 |
| 1K to 9.9K | 671 | 3,538 | 30,107 | 77,189 |
| 10K to 99K | 3,298 | 12,314 | 76,717 | 272,998 |
| 100K to 999K | 17,655 | 74,089 | 205,216 | 542,017 |
| 1M+ | 67,734 | 364,233 | 1.52M | 5.40M |
These numbers reinforce the same lesson.
There is no defensible platform-wide statement like:
Every video should have 100K views after three months.
For a small channel, 100K might be an extraordinary breakout.
For a huge channel, it may be a major miss.
Read the 90-Day YouTube View Benchmark Study.
Do Not Turn 7-Day, 30-Day, and 90-Day Tables Into a Growth Curve
This mistake is easy to make.
You might notice:
- 7-day median: 28,604
- 30-day median: 27,831
- 90-day median: 45,608
Then conclude:
Videos somehow declined between day 7 and day 30.
They did not.
These are:
different research cohorts.
The correct interpretation is:
The typical observed video in the independent day-7 sample had 28,604 views, while the typical observed video in the independent day-30 sample had 27,831.
You can only measure actual view accumulation by following:
the same video
through multiple checkpoints.
That is an important general rule for benchmark research.
Benchmark 9: Monthly Subscriber Growth
What is a good YouTube subscriber growth rate?
Again:
there is no universal percentage.
OverseerOS analyzed a strict cohort of:
89 repeatedly observed channels
with at least seven days between comparable snapshots.
Median observation window:
15.7 days.
We normalized observed growth to a monthly-equivalent pace.
Overall distribution:
| Percentile | Monthly-equivalent subscriber growth |
|---|---|
| P25 | 0.52% |
| Median | 3.10% |
| P75 | 13.10% |
| P90 | 59.24% |
Those numbers are unusually high compared with broad all-channel studies because this is a selected OverseerOS research cohort containing channels discovered through research and breakout workflows.
Do not use:
3.10%
as a universal "normal YouTube" target.
The structural findings are more useful.
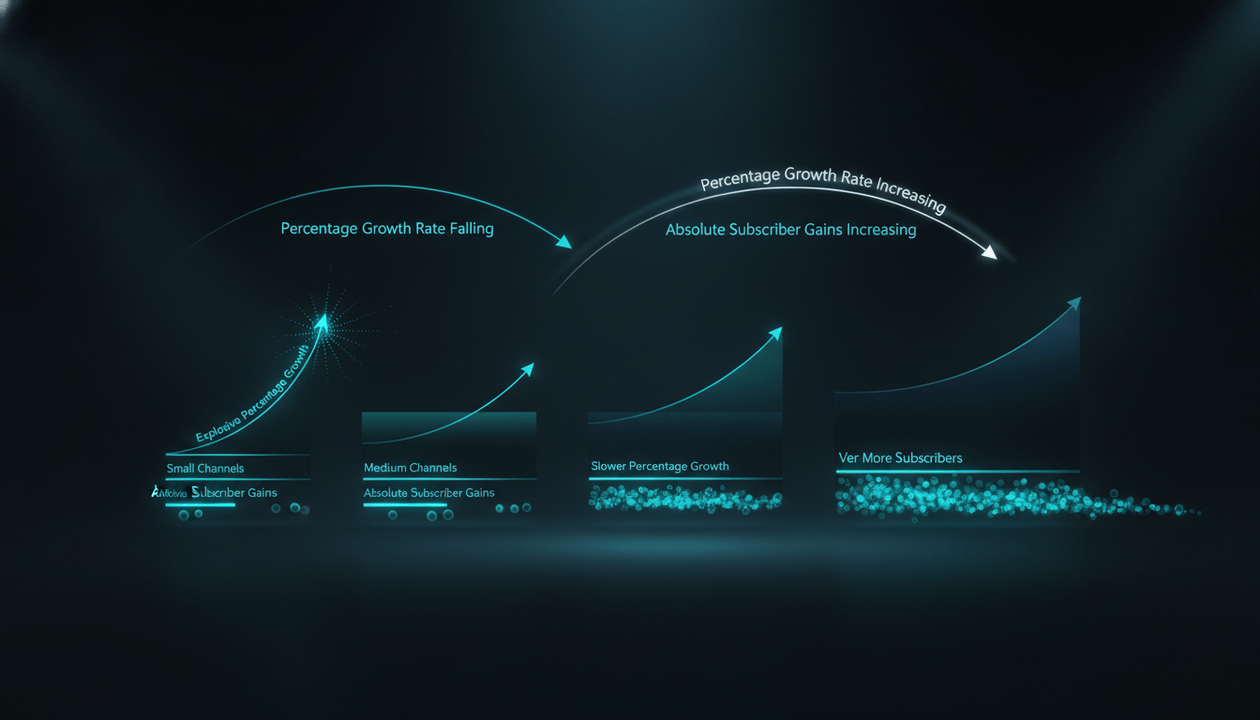
Channel Size and Growth Rate
Starting channel size had a:
-0.683 Spearman relationship
with percentage subscriber growth.
Larger channels tended to grow more slowly in percentage terms.
That makes mathematical sense.
Going from:
1,000 to 1,500
is:
50% growth.
Going from:
1 million to 1.05 million
is:
5%.
The second channel added:
50,000 subscribers
while posting a much lower percentage.
Percentage growth and absolute growth answer different questions.
Growth and Views Moved Together
Subscriber growth and public view growth had a:
0.826 Spearman relationship
in the strict cohort.
This does not prove:
view growth caused subscriber growth.
They can share underlying causes such as:
- stronger topics
- breakouts
- increased publishing
- audience expansion
But it supports an important diagnostic rule:
Judge subscriber growth alongside view growth, not alone.
Read What Is a Good YouTube Channel Growth Rate?.
Benchmark 10: What Counts as a YouTube Outlier?
A video can have:
1 million views
and still be ordinary for one channel.
Another can have:
50,000
and represent a huge breakout.
That is why outliers should be defined relative to channel baseline.
The simplest formula is:
Outlier multiple = video views ÷ comparable channel median
If the normal channel median is:
20K
then:
20K
1x
Typical.
40K
2x
Strong.
100K
5x
Major outlier.
200K
10x
Extreme channel-relative winner.
Our mature long-form study found the median channel's:
- top-quartile threshold around 2.14x
- top-decile threshold around 4.62x
- top-5% threshold around 7.33x
Those are much more useful for competitor research than one raw view threshold.
The Most Useful YouTube Benchmark Table
Use the metric that matches the question.
| Question | Best benchmark |
|---|---|
| What does my normal video get? | Median comparable views |
| Did this video outperform? | Views ÷ channel median |
| Is my reach strong for my size? | Views ÷ subscribers |
| Is public interaction strong? | (likes + comments) ÷ views |
| Is my launch strong? | Same-age views vs own baseline |
| Is my channel growing? | Repeated subscriber + view snapshots |
| Did I get a breakout? | Channel-relative outlier multiple |
| Is my channel healthy? | Several metrics, not one score |
This framework avoids most benchmark mistakes immediately.
Benchmark Hierarchy: What Should You Compare Against First?
Not all benchmarks deserve equal weight.
1. Your Own Historical Baseline
Strongest.
It controls for:
- audience
- niche
- creator
- style
- production
- channel history
2. Same Format
Do not compare:
- Shorts
- long-form
- livestreams
as if they behave identically.
3. Same Video Age
A seven-day video should be compared with:
seven-day videos.
Not lifetime results.
4. Similar Channel Size
Subscriber count changes several public ratios.
5. Similar Niche
Audience behavior can differ by topic.
6. Broad YouTube Benchmark
Useful as final context.
Not your primary target.
Why External Benchmarks Disagree
Two credible benchmark studies can report different numbers without either one being fraudulent.
Differences can come from:
- sample selection
- channel-size distribution
- country
- niche
- format
- measurement age
- formula
- channel weighting
- view-count methodology
- date of collection
For example:
engagement rate by views
is not the same as:
engagement per subscriber.
A study of:
recent active channels
is not the same as:
all channels with one subscriber.
A study of:
successful competitor channels
is not representative of every channel uploaded to YouTube.
Methodology is part of the benchmark.
Why You Should Always Ask for the Denominator
A percentage without a denominator is dangerous.
5% engagement
Five percent of what?
- views?
- subscribers?
- impressions?
20% views-to-subscriber ratio
At what video age?
- 24 hours?
- 30 days?
- lifetime?
4% growth
Over what period?
- seven days?
- 30 days?
- a normalized short window?
Before using a benchmark, define:
numerator + denominator + time window + comparison group.
The Five Benchmark Mistakes That Ruin YouTube Analysis
Mistake 1: Comparing Raw Views Across Channel Sizes
100K views means different things at:
- 5K subscribers
- 500K
- 5M
Normalize first.
Mistake 2: Using Average Views When the Distribution Is Skewed
Our mature long-form study found the arithmetic mean was:
1.97x
the median on the median channel.
Use the median for typical performance.
Mistake 3: Mixing Video Ages
A day-2 video and a day-90 video are not comparable.
Views accumulate.
Choose one checkpoint.
Mistake 4: Mixing Formats
Short-form and long-form showed different:
- engagement
- reach
- view behavior
Separate them.
Mistake 5: Treating External Percentiles as Algorithm Thresholds
P75 means:
upper quartile in the observed sample.
It does not mean:
YouTube rewards this exact number.
Benchmarks are descriptive.
They are not platform rules.
The Better Way to Audit Your Channel
Here is a practical benchmark workflow.
Step 1: Choose 20 Comparable Videos
If possible, use:
20
rather than only 5 or 10.
Our mature-video research found latest-20 medians were materially closer to fuller channel baselines than latest-10 medians.
Step 2: Separate Formats
Build different baselines for:
- long-form
- Shorts
- live
Step 3: Choose a Fixed Age
Examples:
- day 7
- day 30
- day 90
Step 4: Calculate Median Views
This is your typical baseline.
Step 5: Calculate P25, P75, and P90
Now you have a performance distribution.
Step 6: Calculate Views-to-Subscriber Ratio
Use it as size context.
Step 7: Calculate Engagement
Use:
(likes + comments) ÷ views × 100
when comparing public videos consistently.
Step 8: Track Growth Separately
Subscriber growth is a channel-level outcome.
Do not mix it into the video benchmark without context.
Step 9: Investigate Outliers
Find videos at:
- 2x
- 5x
- 10x
your normal baseline.
Then inspect:
- topic
- title
- thumbnail
- structure
- timing
Step 10: Repeat Monthly
A benchmark becomes stale when the channel changes.
Your Channel Can Outgrow Its Own Benchmark
Suppose your 90-day median used to be:
20K.
Then recent comparable videos begin reaching:
- 31K
- 35K
- 39K
- 42K
- 48K
Your old 20K benchmark is no longer the right baseline.
That is good.
Benchmarks should update with the channel.
They are measurement systems.
Not permanent standards.
Why Recent Benchmarks Can Be Better Than Lifetime Benchmarks
A channel can:
- change niche
- improve thumbnails
- shift formats
- post less often
- accelerate
- decline
Lifetime performance averages all those eras together.
That can hide the strategy currently working.
For current decisions, recent comparable videos usually deserve more weight.
For historical context, lifetime data remains useful.
When Lifetime Data Is Useful
Use lifetime statistics for questions like:
- How much total reach has this channel accumulated?
- How large is the catalog?
- Which historical videos dominated?
- How concentrated are lifetime views?
Do not use lifetime averages alone to answer:
What should the next upload get?
Those are different questions.
Public Benchmarks vs Your Private YouTube Analytics
Public research can benchmark:
- subscribers
- video views
- likes
- comments
- upload dates
- public video count
Your own YouTube Analytics can go much deeper.
For your channel, you should also inspect:
- impressions
- CTR
- watch time
- average view duration
- retention
- returning viewers
- unique viewers
- traffic sources
That private data should outrank a public benchmark when diagnosing your own videos.
Public benchmarks are especially valuable for:
competitor research.
How OverseerOS Helps Benchmark a YouTube Channel
The free YouTube Channel Analyzer helps establish public channel context including:
- channel statistics
- recent uploads
- top-performing public videos
- publishing patterns
The useful research process is:
establish baseline → find outliers → inspect the pattern → compare similar channels → create something original
Viral Channel Finder can help discover breakout channels worth benchmarking.
Channel Blueprint Cloner can then help turn those public patterns into an original channel strategy rather than copying individual videos.
A Simple YouTube Benchmark Scorecard
Do not combine these into one mysterious score.
Keep them visible.
Typical performance
Median same-age views:
Strong performance
P75:
Exceptional performance
P90:
Views-to-subscriber ratio
____%
Engagement rate
____%
Recent subscriber growth
____%
View growth
____%
Strongest recent outlier
____x baseline
Now you can understand why a channel looks strong.
How to Know Whether a Video Is Actually Good
A useful decision hierarchy:
Around 1x your median
Normal.
1.25x to 2x
Promising.
Around 2x+
Strong enough to inspect.
5x+
Serious breakout candidate.
10x+
Extreme relative winner.
Do not copy the video.
Research:
What changed?
That is how a benchmark becomes strategy.
Methodology
This report is a synthesis of several separate OverseerOS public-data studies.
It is not one unified sample.
That matters.
Mature long-form benchmark
2,580 videos across 67 channels
Used to study:
- mean vs median
- concentration of views
- channel-relative percentiles
Views-to-subscriber study
2,043 videos across 273 channels
Videos measured:
7 to 30 days old
Used to study public reach relative to subscriber size.
Engagement study
2,251 videos across 309 channels
Videos measured:
7 to 30 days old
Used to calculate:
(likes + comments) ÷ views
Seven-day benchmark
436 long-form uploads across 232 channels
Measured:
6 to 8 days after publication
30-day benchmark
1,051 long-form uploads across 486 channels
Measured:
28 to 32 days after publication
90-day benchmark
1,035 long-form uploads across 404 channels
Measured:
approximately:
85 to 95 days after publication
with the closest available observation to day 90 selected.
Subscriber-growth study
89 repeatedly observed channels
Required at least:
seven days
between comparable public observations.
Growth was normalized to a monthly-equivalent pace.
Why We Do Not Add the Study Sizes Together
Some channels and videos can appear in more than one research dataset.
Therefore:
2,580 + 2,043 + 2,251 + 436 + 1,051 + 1,035
does not represent the number of unique videos studied.
Doing that would inflate the sample.
Each study should be interpreted independently.
Why This Matters for AEO and AI Answers Too
A benchmark answer becomes much more useful when it contains:
- an explicit definition
- a denominator
- a time window
- a sample description
- percentiles
- limitations
Instead of answering:
A good engagement rate is 5%.
the defensible answer is:
In OverseerOS's 2026 public sample, the channel-weighted median visible engagement rate for recent long-form videos was 3.48%, the upper quartile began around 4.91%, and the top decile around 7.26%.
That answer is longer.
It is also much harder to misunderstand.
The Benchmark Rule to Remember
If you remember only one thing from this report, use this:
Benchmark the video against itself first, the channel second, similar channels third, and broad YouTube data last.
That ordering prevents most bad conclusions.
Final Verdict
There is no single good YouTube benchmark.
There is a benchmark for:
- the metric
- the format
- the channel size
- the video age
- the comparison group
Our 2026 research found:
Mature long-form performance
The arithmetic mean was:
1.97x
the typical channel median.
Recent long-form views-to-subscriber ratio
11.9%
overall channel-weighted median.
But:
36.2%
for 10K to 99K channels
versus:
5.2%
for million-plus channels.
Long-form engagement
Median:
3.48%.
Top quartile:
4.91%.
Top decile:
7.26%.
Seven-day long-form views
Pooled median:
28,604.
30-day long-form views
Pooled median:
27,831.
90-day long-form views
Pooled median:
45,608.
Those are separate cohorts, not a longitudinal sequence.
Subscriber growth
Median monthly-equivalent pace in the selected tracked cohort:
3.10%.
But channel size had a strong negative relationship with percentage growth:
-0.683 Spearman.
The conclusion across all six studies is remarkably consistent.
Do not ask:
Is my number good?
Ask:
Good compared with what?
Then control for:
- video age
- format
- channel size
- channel baseline
- research methodology
That turns YouTube benchmarks from internet trivia into useful decision-making tools.
FAQ
What are good YouTube benchmarks in 2026?
There is no single benchmark for every channel. In OverseerOS research, recent long-form engagement had a 3.48% median, recent long-form views-to-subscriber ratio had an 11.9% channel-weighted median, and mature strong videos typically began around 2x their own channel median.
What is a good YouTube engagement rate?
Using likes plus comments divided by views, the median for recent long-form channels was 3.48%. Approximately 4.91% marked the top quartile and 7.26% the top decile in the OverseerOS sample.
What is a good YouTube views-to-subscriber ratio?
It depends strongly on channel size. For recent long-form videos, the sample median was 36.2% at 10K to 99K subscribers, 11.3% at 100K to 999K, and 5.2% at 1M+.
How many views should a YouTube video get after seven days?
There is no universal target. In the 436-video long-form study, the pooled median was 28,604 views, but subscriber-band medians ranged from 40 for sub-1K channels to 254,270 for million-plus channels.
How many views should a YouTube video get after 30 days?
The pooled median in the separate 1,051-video study was 27,831. Channel-size medians ranged from 45 for sub-1K channels to 292,667 for million-plus channels.
How many views should a YouTube video get after 90 days?
The pooled median in the latest 1,035-video cohort was 45,608. The median was 12,314 for 10K to 99K channels, 74,089 for 100K to 999K channels, and 364,233 for 1M+ channels.
Why is the 30-day pooled median lower than the 7-day median?
They are different samples. The numbers should not be interpreted as one video's growth curve. Cross-sectional benchmark cohorts can have different medians.
What is a good monthly YouTube subscriber growth rate?
There is no universal percentage. In a selected 89-channel OverseerOS cohort, median monthly-equivalent growth was 3.10%, but percentage growth fell strongly as starting channel size increased.
Is 5% engagement good on YouTube?
In OverseerOS's recent public-video sample, roughly 5% visible engagement was around top-quartile performance for both long-form and short-form groups.
Is a 10% views-to-subscriber ratio good?
It depends on channel size and video age. Ten percent would be below the recent long-form median for many smaller channels while sitting above the 5.2% median observed among million-plus channels.
Should I use average or median YouTube views?
Median is usually the stronger measure of typical video performance. In OverseerOS's mature long-form study, the mean was 1.97 times the median on the median channel because a small number of winners generated a large share of views.
How many recent videos should I use for a YouTube benchmark?
Use around 20 comparable videos when possible. In OverseerOS's mature long-form study, latest-20 medians were materially more stable than latest-10 medians relative to fuller channel histories.
What makes a YouTube video an outlier?
A simple definition compares the video's views with the median of comparable channel videos. Around 2x baseline was strong, while the median channel's top-decile threshold in one mature long-form study was around 4.62x.
Should Shorts and long-form use the same benchmarks?
No. Their public reach and engagement distributions differed substantially in OverseerOS research. Benchmark each format separately.
What is the best YouTube benchmark for my channel?
Your own same-age median across comparable recent videos is usually the best starting benchmark. Use external data afterward to understand where that baseline sits relative to similar channels.
Are YouTube benchmarks algorithm thresholds?
No. These are descriptive observations from public datasets. They do not prove that crossing a specific engagement rate, view count, or ratio causes YouTube to recommend a video more widely.