How Many Views Should a YouTube Video Get in 90 Days? We Analyzed 1,033 Uploads
Ninety days is a useful point in a YouTube video's life.
The upload is no longer new.
The launch spike is over.
The video has had time to be discovered through:
- Home
- Suggested videos
- Search
- subscriptions
- playlists
- external traffic
- returning viewers
- entirely new audiences
So creators eventually ask:
How many views should a YouTube video have after 90 days?
Most answers online give you a fixed target.
10,000 views.
100,000 views.
10% of your subscribers.
Those rules break almost immediately because a video from a 3,000-subscriber channel and a video from a 3-million-subscriber channel should not be benchmarked against the same raw number.
OverseerOS analyzed 1,033 long-form YouTube uploads across 410 channels and measured each video as close as possible to:
90 days after publication.
The median measurement point was:
89.84 days.
Across the complete sample, the median video had:
45,608 public views.
But the pooled number is almost useless without channel-size context.
The actual medians were:
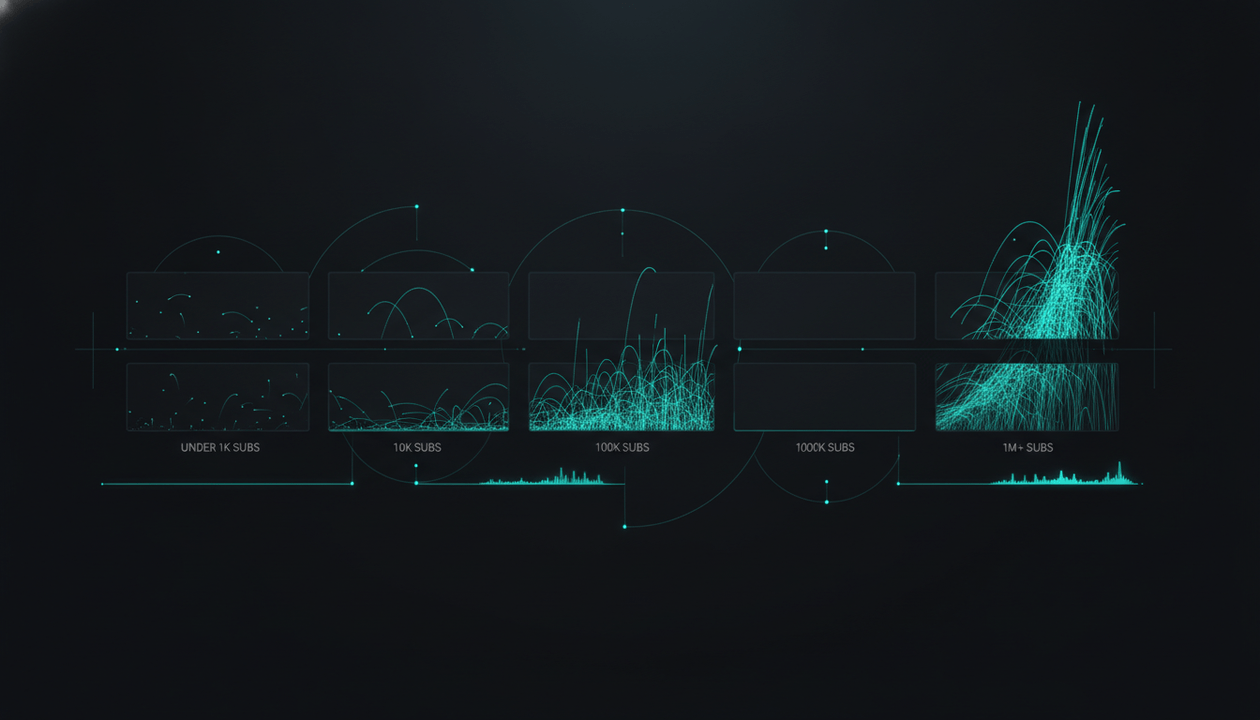
| Channel size | Videos | Channels | Median views at ~90 days |
|---|---|---|---|
| Under 1K subscribers | 38 | 19 | 62 |
| 1K to 9.9K | 108 | 39 | 3,019 |
| 10K to 99K | 285 | 107 | 13,126 |
| 100K to 999K | 369 | 143 | 71,118 |
| 1M+ | 232 | 103 | 362,183 |
And even those medians hide enormous variation.
For 100K to 999K channels, the middle 50% ranged from:
18,405 to 201,491 views.
For million-plus channels:
69,840 to 1.51 million.
So the strongest answer is not:
A good YouTube video should have 50,000 views after 90 days.
It is:
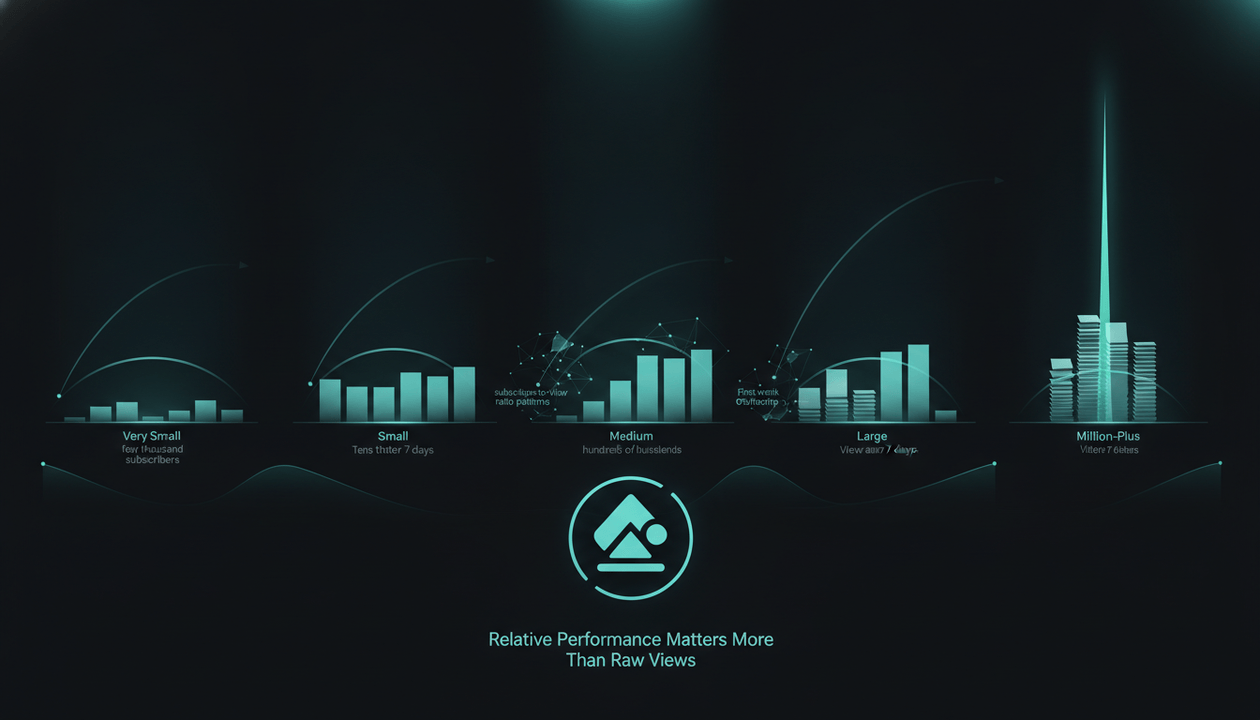
A good 90-day result is one that materially outperforms your own normal 90-day performance for comparable videos.
External benchmarks help with context.
Your own baseline tells you whether the video actually won.
Key Findings
OverseerOS analyzed:
1,033 long-form uploads
across:
410 channels.
Every video was measured between:
85 and 95 days after publication
with the closest available observation to day 90 selected.
Median measurement age:
89.84 days
Overall 90-day view distribution:
| Percentile | Views |
|---|---|
| P10 | 868 |
| P25 | 5,727 |
| Median | 45,608 |
| P75 | 220,317 |
| P90 | 892,462 |
Additional findings:
- 70.0% of the videos had at least 10,000 views
- 38.6% had at least 100,000
- 8.7% had at least 1 million
- Median 90-day views equaled 23.7% of the channel's public subscriber count
- 21.9% of videos had at least as many views as the channel had subscribers
- A channel-weighted analysis produced a median of 63,588 views
- Channel-weighted median views-to-subscriber ratio was 29.8%
- A tighter sensitivity window of 88 to 92 days still produced the exact same median: 45,608 views
That last result matters.
The headline median was not being driven by videos measured at the outer edge of the 85 to 95-day window.
The Direct Answer
How many views should a YouTube video get in 90 days?
There is no universal target.
In this OverseerOS sample, the observed medians were:
- Under 1K subscribers: 62
- 1K to 9.9K: 3,019
- 10K to 99K: 13,126
- 100K to 999K: 71,118
- 1M+: 362,183
But those are external reference points, not quotas.
If your own previous comparable videos normally reach:
8,000 views after 90 days
and a new video reaches:
24,000
that video is:
3x your baseline.
That is strong.
If another channel normally gets:
500,000
and its new video reaches:
150,000
the second video has more raw views but is performing much worse relative to its channel.
Raw views tell you:
scale.
Relative views tell you:
performance.
90-Day YouTube View Benchmarks by Channel Size
Here is the full primary distribution.
| Channel size | P25 | Median | P75 | P90 |
|---|---|---|---|---|
| Under 1K | 40 | 62 | 194 | 548 |
| 1K to 9.9K | 612 | 3,019 | 26,172 | 76,560 |
| 10K to 99K | 3,363 | 13,126 | 79,095 | 243,735 |
| 100K to 999K | 18,405 | 71,118 | 201,491 | 541,862 |
| 1M+ | 69,840 | 362,183 | 1,511,058 | 5,442,133 |
The spread matters more than the median.
A benchmark should describe:
a distribution
not:
one magic number.
How to Read the Benchmark Table
Below P25
Your video sits below the lower quartile of this external sample for its broad channel-size band.
That does not automatically mean:
bad video.
Your niche, format, audience, and historical baseline may be completely different.
But it is enough to investigate.
Around the median
The result is close to the middle of the observed external cohort.
Again, that does not tell you whether the upload beat your own channel.
Above P75
The video sits in the upper quarter of this research sample.
That is strong external context.
Around P90
The video is unusually large relative to most observed videos from channels in that subscriber band.
But P90 still does not automatically mean:
viral.
A 500K-view video on a channel that normally gets 2 million may still be weak.
A 50K-view video on a channel that normally gets 2,000 may be an enormous breakout.
Why 90 Days Is a Useful YouTube Benchmark
The first 24 hours can be chaotic.
The first week is still highly launch-sensitive.
At 30 days, a video has had more time to settle.
By 90 days, the public view count often gives a much fuller picture of the video's medium-term reach.
That does not mean:
90 days is when YouTube stops recommending a video.
There is no universal expiration date.
YouTube recommendations appear across surfaces including Home and Up Next and are personalized using many viewer signals. Source: YouTube Help
Videos can continue accumulating views long after day 90.
So the 90-day mark is best treated as:
a standardized comparison point
not:
a finish line.
Finding 1: The Overall Median Was 45,608 Views
Across all:
1,033 videos
the median at approximately day 90 was:
45,608.
That sounds like a useful benchmark.
Until you look at the distribution.
P10
868
P25
5,727
Median
45,608
P75
220,317
P90
892,462
The P90 video had almost:
20 times
the views of the median.
The P75 video had nearly:
5 times
the median.
YouTube performance is heavily skewed.
That is why arithmetic averages are often poor benchmarks.
Why Median Views Are Better Than Average Views
Imagine ten videos reach:
3K, 5K, 7K, 8K, 9K, 10K, 12K, 15K, 80K, 1M
The 1-million-view video pulls the average upward dramatically.
But most uploads are nowhere near that number.
The median remains much closer to:
typical performance.
For benchmarking:
Median describes normal. Outliers describe upside.
You need both.
Finding 2: Channel Size Changed the Benchmark Dramatically
Compare:
Under 1K subscribers
Median 90-day views:
62
10K to 99K
13,126
100K to 999K
71,118
1M+
362,183
One universal target would be absurd across these groups.
Imagine telling every creator:
A good video needs 50,000 views in 90 days.
For a 500-subscriber channel:
50K could be extraordinary.
For a 5-million-subscriber channel:
50K could be severe underperformance.
The benchmark only becomes meaningful after adding context.
Finding 3: Smaller Channels Had Much More Volatile Outcomes
The 1K to 9.9K group is especially revealing.
Median:
3,019
P25:
612
P75:
26,172
P90:
76,560
The 75th-percentile video had roughly:
43 times
the views of the 25th-percentile video.
That is enormous dispersion.
For smaller channels, two videos from creators with similar subscriber counts can have radically different reach.
This is why channel size alone cannot reliably predict video performance.
Finding 4: Million-Subscriber Channels Still Had Huge Variance
Large channels were not remotely predictable either.
Among the:
232 videos
from channels with at least 1 million subscribers:
P25:
69,840
Median:
362,183
P75:
1.51M
P90:
5.44M
The 90th percentile had about:
78 times
the views of the 25th percentile.
So:
big channel = predictable views
is false.
Large channels still produce:
- underperformers
- normal uploads
- strong winners
- giant outliers
at radically different scales.
Finding 5: 8.7% of Videos Had Reached 1 Million Views by Day 90
Across the full sample:
90 of 1,033 videos
had reached at least:
1 million views
by approximately day 90.
That is:
8.7%.
Meanwhile:
38.6%
had reached at least:
100,000.
And:
70.0%
had reached at least:
10,000.
These figures should not be interpreted as:
8.7% of all YouTube videos get 1 million views.
Absolutely not.
The OverseerOS research corpus is selected through channel-analysis, competitor-research, and breakout-discovery workflows.
It is not a random sample of all videos uploaded to YouTube.
These percentages describe:
this research cohort.
That distinction is critical.
90-Day View Distribution by Raw Milestone
| 90-day views | Videos |
|---|---|
| Under 1K | 115 |
| 1K to under 10K | 195 |
| 10K to under 100K | 324 |
| 100K to under 1M | 309 |
| 1M+ | 90 |
This is useful for understanding the shape of the sample.
It is not a universal platform probability table.
Finding 6: Views-to-Subscriber Ratios Changed Sharply by Channel Size
Another common benchmark says:
A good video should get X% of your subscribers in views.
That rule is also too simplistic.
At approximately day 90, median views represented:
| Channel size | Median views / subscribers |
|---|---|
| Under 1K | 31.5% |
| 1K to 9.9K | 59.6% |
| 10K to 99K | 42.9% |
| 100K to 999K | 22.1% |
| 1M+ | 7.2% |
There is no stable universal ratio.
The 1K to 9.9K group had a median close to:
60% of subscribers.
The million-plus group:
7.2%.
That is more than an:
8x difference.
So:
10% of subscribers is good
could mean:
- weak for one channel
- normal for another
- strong for another
depending on scale and channel history.
Finding 7: 21.9% of Videos Reached the Channel's Subscriber Count
Across videos where a usable nearby public subscriber observation was available:
21.9%
had at least as many public views as the channel had public subscribers.
Again:
views do not equal unique viewers.
And:
views equal to subscriber count does not mean:
every subscriber watched.
Views can come from:
- subscribers
- non-subscribers
- repeat viewers
The useful interpretation is:
About one-fifth of videos in this selected cohort had public reach by day 90 at least equal to the size of the channel's public subscriber base.
The Rate Changed Dramatically With Channel Size
| Channel size | Videos reaching subscriber count |
|---|---|
| Under 1K | 28.9% |
| 1K to 9.9K | 37.0% |
| 10K to 99K | 32.6% |
| 100K to 999K | 20.1% |
| 1M+ | 3.4% |
The million-plus figure is especially important.
Only:
3.4%
of observed videos in that group had views equal to or above public subscriber count at approximately day 90.
That does not mean those videos failed.
A channel with:
10 million subscribers
getting:
2 million views
has still reached an enormous audience.
The lifetime subscriber counter simply represents a much larger accumulated audience than the active audience for one specific upload.
Subscribers Are Not the Same as Active Viewers
Subscribers can accumulate across:
- many years
- different formats
- different topics
- viral Shorts
- historical eras of the channel
- audience-interest changes
So:
1 million subscribers
does not mean:
1 million people are waiting for the next long-form upload.
This is why subscriber count should be used as context rather than a guaranteed audience floor.
Is a Video Dead After 90 Days?
No.
A video having modest views at day 90 does not mean it can never grow again.
YouTube recommendations can surface videos through personalized discovery surfaces such as Home and Up Next, while Search can continue serving videos for relevant queries. Source: YouTube Help
Some videos have:
- fast launch curves
- slow evergreen curves
- search-driven accumulation
- delayed topical relevance
- renewed interest after external events
The 90-day benchmark tells you:
where the video is at day 90.
It does not tell you:
where it will finish.
Search Videos Can Behave Differently From Browse Videos
Consider two videos.
Video A
Topic:
Breaking AI Update Explained
Its demand may be heavily concentrated near publication.
Video B
Topic:
How to Remove Background Noise in Premiere Pro
That problem may continue being searched for months or years.
Both can have identical 90-day views.
Their future trajectories can still differ dramatically.
That is why long-term performance should be interpreted alongside:
- topic type
- traffic source
- search intent
- freshness
- competitive change
For your own videos, YouTube Studio is the correct place to inspect traffic sources and private analytics.
What If My Video Is Below the Benchmark?
Do not immediately:
- delete it
- change everything
- declare the channel dead
First compare it with your own history.
Ask:
Is it below my normal 90-day result?
If not, the external benchmark may simply be irrelevant.
Did the topic have lower demand?
A smaller topic can still be strategically valuable.
Was the packaging weak?
For your own channel, inspect impressions and CTR.
YouTube says impressions and CTR should be interpreted together and with context because CTR can change as a video reaches broader audiences. Source: YouTube Help
Did viewers stay?
Check retention.
YouTube's audience-retention report shows where viewers remained engaged or dropped off and compares performance with typical retention. Source: YouTube Help
Did the video serve a strategic purpose?
Some videos exist to:
- rank in Search
- support a funnel
- attract buyers
- build authority
- answer existing audience questions
Views are not always the only business outcome.
What If My Video Is Above the Benchmark?
Do not simply celebrate the raw number.
Investigate the reason.
Ask:
- Was the topic unusually strong?
- Was the angle new?
- Did the title promise differ?
- Was the thumbnail clearer?
- Did the format change?
- Was there a timing advantage?
- Did the video attract non-subscribers?
- Is there a follow-up opportunity?
The job is to turn:
one strong result
into:
a useful hypothesis.
A Better 90-Day Performance Formula
Instead of asking:
Did I get enough views?
calculate:
90-day relative performance = current video's 90-day views ÷ median 90-day views of comparable channel videos
Example:
Your last 12 comparable videos have a 90-day median of:
18,000 views.
New video:
54,000.
Relative performance:
3x.
That is strategically useful.
Another creator may get:
250,000
and still only produce:
0.6x their normal baseline.
Raw views do not tell you which upload actually overperformed.
A Practical 90-Day Relative Performance Scale
This is an OverseerOS research framework, not an official YouTube classification.
| Performance vs your own 90-day median | Interpretation |
|---|---|
| Under 0.5x | Major underperformance |
| 0.5x to 0.75x | Clearly below normal |
| 0.75x to 1.25x | Around normal |
| 1.25x to 2x | Strong |
| 2x to 5x | Breakout candidate |
| 5x+ | Major channel-relative outlier |
The exact thresholds are a practical heuristic.
The important principle is:
compare the video with the channel before comparing it with the internet.
How to Build Your Own 90-Day YouTube Benchmark
You can do this manually.
Step 1: Pick Comparable Videos
Use at least:
10 to 20
recent videos where possible.
Keep formats separate.
Do not mix:
- Shorts
- long-form
- livestreams
into one baseline.
Step 2: Record Each Video's Views at Day 90
Use exactly:
90 days after publication
where possible.
Consistency matters.
Step 3: Calculate the Median
This is your normal 90-day baseline.
Step 4: Calculate P25 and P75
Now you have a range.
Step 5: Identify 2x and 5x Outliers
Those are the uploads worth investigating.
Step 6: Record the Topic and Packaging
Track:
- title
- thumbnail
- topic
- format
- video length
Step 7: Repeat
Over time, your benchmark becomes much more useful than a generic industry number.
Example
Suppose your last 12 videos reached:
9K, 11K, 12K, 13K, 14K, 15K, 17K, 19K, 24K, 28K, 75K, 210K
The 75K and 210K uploads are clearly strong.
Do not let them define "normal."
The median sits around:
16K.
Now your new video reaches:
48K.
That is roughly:
3x your baseline.
That is the comparison that matters.
Why You Should Not Mix Shorts and Long-Form
This study focuses specifically on:
long-form YouTube videos.
Shorts operate under different:
- viewing behavior
- recommendation surfaces
- consumption patterns
- view scales
Combining them would make the benchmark much harder to interpret.
A channel can have:
- Shorts with millions of views
- long-form videos with tens of thousands
without either format being unhealthy.
Benchmark each format separately.
Why Channel Size Still Is Not Enough
Even inside one subscriber band, performance varied enormously.
Take 10K to 99K channels.
P25:
3,363
Median:
13,126
P75:
79,095
P90:
243,735
Two 50K-subscriber channels can therefore have completely different video-performance distributions.
Channel size narrows the comparison.
It does not finish it.
The Better Benchmark Hierarchy
Use these benchmarks in order.
1. Your Own Comparable Videos
Strongest benchmark.
2. Your Own Channel at the Same Video Age
Essential.
Do not compare:
day 7
with:
day 90.
3. Similar Channel Size
Useful external context.
4. Similar Niche and Format
Even better if available.
5. Broad Internet Benchmarks
Useful only as rough context.
The further you move down the list, the less personalized the benchmark becomes.
90 Days vs 30 Days
OverseerOS previously analyzed:
1,051 long-form uploads
near day 30.
That study found a pooled median of:
27,831 views.
The current 90-day cohort has a median of:
45,608.
It would be tempting to conclude:
Videos gained a median 64% more views between day 30 and day 90.
That would be statistically wrong.
These are different cohorts of videos.
We did not have day-30 and day-90 observations for the same videos in this current comparison.
So the correct statement is:
The separate 90-day cohort had a higher median than the separate 30-day cohort.
It is not a longitudinal growth measurement.
This distinction matters.
Good research should resist an attractive conclusion when the design cannot support it.
For the earlier benchmark, see How Many Views Should a YouTube Video Get in 30 Days?.
Why We Used an 85 to 95-Day Window
Public observations do not always occur exactly at:
90.000 days.
So we accepted observations between:
85 and 95 days
and selected the observation closest to day 90 for every video.
Median measurement age:
89.84 days.
That is extremely close to the target.
Sensitivity Check: 88 to 92 Days
To make sure the wider window was not distorting the result, we reran the study using only videos observed between:
88 and 92 days.
That tighter sample contained:
437 videos
across:
276 channels.
Median measurement age:
89.98 days.
Results:
| Metric | Main 85-95 day sample | Tight 88-92 day sample |
|---|---|---|
| Videos | 1,033 | 437 |
| Median views | 45,608 | 45,608 |
| P25 | 5,727 | 6,893 |
| P75 | 220,317 | 240,913 |
| P90 | 892,462 | 1,045,266 |
The exact upper distribution moved.
The median did not move at all.
That increases confidence that the central result is not an artifact of the age window.
We Also Tested Channel Weighting
A video-level sample allows channels contributing several qualifying videos to have more influence.
So we also calculated a median for each channel first.
Then we took the median across channels.
Pooled video-level median
45,608 views
Channel-weighted median
63,588 views
The values differ.
That is expected.
They answer slightly different questions.
Pooled result:
What did the typical observed video do?
Channel-weighted result:
What did the typical observed channel's median 90-day video do?
The channel-weighted median views-to-subscriber ratio was:
29.8%.
The pooled ratio:
23.7%.
Again, there is no sacred single number.
All 1,033 Observations Came From the Same Research Source
Another useful methodological check:
Every selected 90-day video observation came from the same OverseerOS observation source:
channel_stats
That removes one potential source of heterogeneity.
We did not combine several different collection pipelines in the primary 90-day view measurement.
How We Analyzed the 1,033 Videos
The study used public YouTube observations stored in the OverseerOS research corpus.
A video qualified when:
- it was long-form
- it had a valid publication timestamp
- it had a positive public view count
- OverseerOS observed it between 85 and 95 days after publication
If several observations existed in that range, we selected:
the one closest to exactly day 90.
That produced:
1,033 unique videos
across:
410 channels.
For subscriber-band analysis, we used the closest available positive public channel-subscriber observation to the video's selected 90-day view observation.
One video did not have a usable corresponding subscriber snapshot for the band analysis, so the subscriber-band tables contain:
1,032 videos.
Why We Use Percentiles
YouTube view distributions are highly skewed.
A handful of giant winners can distort an average.
Percentiles make the shape visible.
P25 tells you the lower-quarter boundary.
Median tells you the middle.
P75 shows the upper quarter.
P90 shows unusually high performance.
That is much more informative than:
average YouTube video gets X views.
Important Limitations
This study has several.
1. The sample is not random YouTube
OverseerOS channels enter the research corpus through workflows such as:
- channel analysis
- competitor research
- breakout discovery
- product usage
- internal research
The data is therefore selected.
Do not interpret the pooled median as:
the median of every YouTube upload.
It is not.
2. The study is long-form only
Shorts need their own benchmarks.
3. Subscriber bands are broad
A:
110K
channel and:
900K
channel sit in the same band.
Use the groups as context, not precision.
4. Public subscribers are not active audience
Subscriber count accumulates historically.
5. Views are not unique viewers
The same person can generate more than one view under YouTube's counting rules.
6. The study does not see private analytics
We cannot see competitors':
- impressions
- CTR
- audience retention
- watch time
- traffic sources
- returning viewers
7. The study is cross-sectional
It measures videos near one age.
It does not prove how every individual video accumulated its views over the previous 90 days.
8. No causal claims
The data cannot prove:
- titles caused the views
- thumbnails caused the views
- subscriber count caused the views
- publishing frequency caused the views
It measures outcomes.
What YouTube Studio Can Tell You That Public Research Cannot
For your own video, raw views are only the beginning.
YouTube Studio can show metrics including:
- impressions
- impressions CTR
- watch time
- average view duration
- average percentage viewed
- audience retention
- traffic sources
YouTube specifically warns creators not to interpret CTR without context because reach and audience composition can change the number. Source: YouTube Help
That is why the best diagnosis of your own 90-day performance combines:
public outcome
with:
private cause signals.
A 90-Day YouTube Video Audit
At day 90, review these six questions.
1. Did the video beat my normal 90-day view baseline?
Start here.
2. Did impressions continue expanding?
For your own channel, inspect Reach analytics.
3. Did CTR hold up as the audience broadened?
YouTube notes that CTR can fall when content reaches a wider audience, which is not automatically a bad sign. Source: YouTube Help
4. Did retention support continued distribution?
Review audience-retention data.
5. Which traffic sources produced the long tail?
Search and Suggested can create very different lifecycles.
6. Is there a follow-up?
If the topic significantly outperformed baseline, do not stop at admiration.
Investigate whether the demand is repeatable.
If a Video Is Still Growing at Day 90
That is strategically interesting.
Ask:
- Is Search continuing to feed it?
- Is Suggested traffic rising?
- Is another video sending viewers into it?
- Did a related topic become more relevant?
- Is the video evergreen?
- Can you create a logical follow-up?
Do not change a working asset merely because 90 days passed.
If a Video Has Flatlined by Day 90
The next action depends on the cause.
Strong impressions, weak CTR
Packaging may be limiting performance.
Strong CTR, weak retention
The promise may be stronger than the delivery.
Low impressions but good internal performance
The topic may have limited available audience or face strong competition.
Everything weak
The idea itself may simply have missed.
That is useful information too.
Should You Change the Thumbnail After 90 Days?
Sometimes.
But do not treat:
old video
as sufficient reason.
A better trigger is:
The video has meaningful impressions but packaging appears weak relative to your normal performance.
YouTube recommends interpreting CTR alongside impressions and other context rather than chasing small CTR movements. Source: YouTube Help
If you change packaging:
record the date.
Then measure what happens.
How OverseerOS Helps Analyze Video Performance
The free YouTube Channel Analyzer helps creators inspect public channel statistics, recent uploads, and top-performing public videos.
For deeper competitor research, OverseerOS can help connect:
- channel baselines
- outlier videos
- topic research
- channel strategy
- thumbnails
- scripts
Viral Channel Finder can help surface breakout channels worth investigating.
The goal is not:
find a big view count and copy it.
It is:
find abnormal evidence, understand why it deserves attention, and build an original version for your own audience.
The Better Question Than "How Many Views Should I Have?"
Ask:
How far above or below my normal 90-day performance is this video?
That removes most of the confusion.
A raw:
20,000 views
can be:
- a disaster
- normal
- strong
- a breakout
depending on the channel.
The ratio gives the number meaning.
Final Verdict
How many views should a YouTube video get in 90 days?
There is no universal target.
In OverseerOS's 1,033-video long-form sample, the median at approximately day 90 was:
45,608 views.
But the medians by channel size ranged from:
62
for sub-1K channels
to:
362,183
for million-plus channels.
And even inside those groups, the distribution was enormous.
So do not judge a video using:
one internet benchmark.
Use:
- your own 90-day median
- channel size
- comparable format
- topic context
- external percentile ranges
The strongest benchmark is:
How did this video perform relative to what my channel normally achieves by the same age?
If your normal result is:
15,000
and this video reaches:
60,000
you have a:
4x winner.
That matters more than whether somebody else's video has 1 million views.
Raw views tell you how big the result was.
Relative performance tells you:
whether something unusual happened.
That is the signal worth studying.
FAQ
How many views should a YouTube video get in 90 days?
There is no universal target. In OverseerOS's sample of 1,033 long-form videos, the median was 45,608 views at approximately 90 days, but medians varied dramatically by channel size.
What is a good number of views after 3 months on YouTube?
A good result is one that meaningfully exceeds your own normal three-month performance for comparable videos. External subscriber-size benchmarks can provide additional context.
How many views should a 1,000-subscriber channel get in 90 days?
There is no fixed number. In the 1K to 9.9K subscriber cohort, the observed median was 3,019 views, with the middle 50% ranging from 612 to 26,172.
How many views should a 10K YouTube channel get after 90 days?
Among channels with 10K to 99K subscribers, the median observed 90-day view count was 13,126. The middle 50% ranged from 3,363 to 79,095.
How many views should a 100K YouTube channel get in 90 days?
For channels between 100K and 999K subscribers, the median observed result was 71,118 views. The 25th percentile was 18,405 and the 75th percentile was 201,491.
How many views should a 1M subscriber channel get in 90 days?
The million-plus group had a median of 362,183 views. The middle 50% ranged from 69,840 to 1.51 million, showing enormous variation even among large channels.
Is a YouTube video dead after 90 days?
No. Videos can continue receiving traffic through Search, Home, Suggested videos, playlists, external sources, and renewed topic interest long after 90 days.
Should a video get as many views as the channel has subscribers?
Not necessarily. In this study, 21.9% of videos had reached at least the channel's subscriber count by around day 90, and the rate fell sharply for million-plus channels.
What percentage of subscribers should watch a YouTube video?
There is no universal percentage. Median 90-day views represented 59.6% of subscribers for 1K to 9.9K channels but only 7.2% for 1M+ channels in this research cohort.
Should I use average or median views to benchmark my YouTube videos?
Median is usually more useful for typical performance because one viral video can heavily distort an arithmetic average.
How do I know if my YouTube video is a breakout?
Compare its 90-day views with your channel's median 90-day views for comparable videos. A video reaching 2x, 5x, or 10x normal performance is much more informative than a raw view count alone.
Should I compare my 90-day views with another channel?
Yes, but only as secondary context. Your own same-age baseline is more informative because channels differ by size, audience, niche, format, and historical performance.
Can I compare 30-day and 90-day YouTube benchmarks?
You can compare separate cohorts descriptively, but you should not infer how much an individual video grew unless the same videos were measured at both ages.
Why do some videos keep growing after 90 days?
Different topics and traffic sources have different lifecycles. Evergreen Search traffic, Suggested-video distribution, changing viewer interest, and renewed relevance can all extend a video's view accumulation.
What should I check in YouTube Analytics after 90 days?
Review views relative to your normal baseline, impressions, CTR, watch time, retention, average view duration, traffic sources, and whether the topic deserves a follow-up.