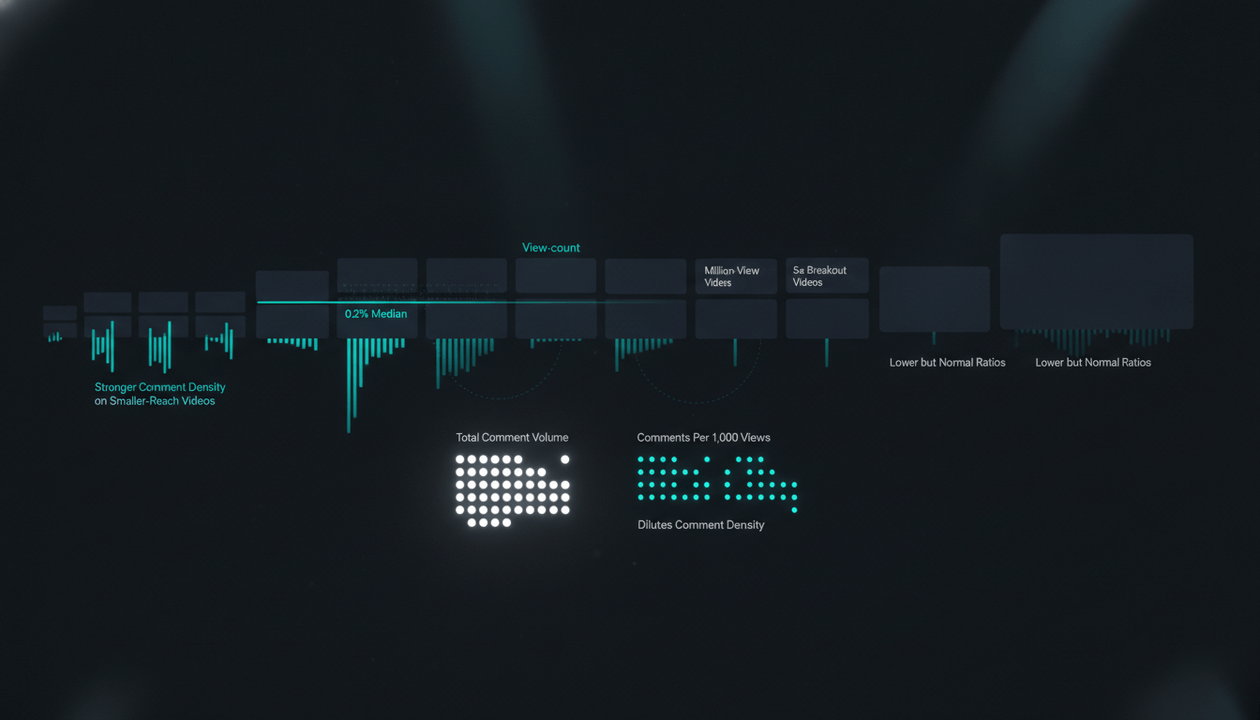
A good YouTube engagement rate is not one universal percentage, but our analysis gives creators a much better benchmark than guesswork.
OverseerOS analyzed 2,251 recent public YouTube videos across 309 channels, controlling for video age and recent upload history.
Using the public-data formula:
YouTube engagement rate = (likes + comments) ÷ views × 100
we found a channel-weighted median engagement rate of:
- 3.48% for long-form YouTube videos
- 2.71% for short-form videos of 3 minutes or less
The strongest practical benchmark was even simpler:
Around 5% engagement was already top-quartile performance in both formats.
For long-form channels, the 75th percentile was 4.91%.
For short-form channels, it was 4.55%.
But the study also uncovered something that makes most generic engagement-rate advice less useful.
Subscriber count barely explained long-form engagement rate in this sample.
Long-form median engagement was:
- 3.41% below 10K subscribers
- 3.44% at 10K to 99K
- 3.66% at 100K to 999K
- 3.33% at 1M+
In other words, engagement by views did not simply collapse as channels became larger.
And some of the videos with the widest reach actually had lower engagement rates.
That changes how you should interpret the metric.
A lower engagement rate does not automatically mean the video is failing.
Sometimes it can appear alongside a video reaching far beyond the channel's usual audience.
Key Findings
| Finding | OverseerOS result |
|---|---|
| Videos analyzed | 2,251 |
| Channels represented | 309 |
| Video age at observation | 7 to 30 days |
| Long-form videos | 1,272 |
| Long-form channels | 246 |
| Short-form videos, ≤3 min | 979 |
| Short-form channels | 152 |
| Median long-form engagement rate | 3.48% |
| Median short-form engagement rate | 2.71% |
| Long-form 75th percentile | 4.91% |
| Short-form 75th percentile | 4.55% |
| Long-form 90th percentile | 7.26% |
| Short-form 90th percentile | 6.67% |
| Median long-form like rate | 3.11% |
| Median long-form comment rate | 0.238% |
| Median short-form like rate | 2.60% |
| Median short-form comment rate | 0.032% |
| Channels with both formats in paired analysis | 89 |
The key takeaway is:
For public YouTube engagement measured as likes plus comments divided by views, roughly 3% to 4% was typical in this sample, around 5% was strong, and roughly 7% placed a channel near the top decile. But format, reach, and the channel's own baseline still matter.
What Is YouTube Engagement Rate?
YouTube engagement rate is a way to measure how often viewers visibly interact with a video relative to the number of views it receives.
There is more than one way to calculate it.
For this study, we use the formula that can be applied consistently to public videos:
(likes + comments) ÷ views × 100
Example:
A video gets:
- 100,000 views
- 3,200 likes
- 300 comments
Total visible engagements:
3,500
Engagement rate:
3,500 ÷ 100,000 × 100 = 3.5%
That means the video generated approximately:
35 visible likes or comments per 1,000 views.
Why we do not include shares
Shares are useful engagement signals, but public competitor data does not provide a comparable share count for every YouTube video in this dataset.
So our public benchmark includes only:
likes + comments
That makes the metric reproducible when analyzing your own channel or another public YouTube channel.
If you are analyzing your own channel inside YouTube Studio, you have access to additional private metrics that public competitor research cannot see.
How We Analyzed 2,251 Recent YouTube Videos
The purpose of the study was not to calculate one giant platform average.
We wanted a benchmark that was more useful for creators comparing recent videos.
So we applied several controls.
The final cohort contained:
2,251 videos from 309 channels
including:
- 1,272 long-form videos from 246 channels
- 979 short-form videos from 152 channels
The public observations were collected between:
August 11 and August 20, 2026
The qualifying videos were published between:
July 12 and August 12, 2026
Every video had to be 7 to 30 days old
This matters because interaction ratios can look different immediately after publication.
We did not mix:
- one-hour-old videos
- three-year-old evergreen videos
- week-old uploads
into a single benchmark.
Every primary video was between:
7 and 30 days old
at the observation point.
We used only recent uploads
For each channel, we ranked the captured videos by publication date and kept only the:
20 most recent captured uploads
This reduces the influence of large historical back catalogs and keeps the comparison centered on current channel behavior.
We required valid public engagement data
Every qualifying video needed:
- public views above zero
- public like count
- public comment count
- publication date
- known content format
- same-day positive public subscriber snapshot
We separated long-form and short-form
The dataset classifies videos by duration.
For this study:
- long-form: more than 3 minutes
- short-form: 3 minutes or less
The short-form group should not be interpreted as a perfect classification of the YouTube Shorts surface because duration alone does not reveal every format characteristic.
So throughout this study we refer to it as:
short-form videos of 3 minutes or less
We stopped prolific channels from dominating the benchmark
One channel might contribute two qualifying videos.
Another might contribute fifteen.
Simply pooling every video would give the second channel much more influence.
So our primary benchmarks are channel-weighted.
For each channel and format:
- We calculated engagement rate for every qualifying video.
- We calculated the median engagement rate for that channel.
- We calculated percentiles across those channel medians.
That makes the typical channel, rather than the most prolific channel, the main unit of comparison.
What Is a Good YouTube Engagement Rate?
Based on the channel-weighted distributions in this study, here is the most practical benchmark.
Long-form YouTube engagement benchmarks
| Channel-level median engagement | Position in this sample |
|---|---|
| Below 2.22% | Bottom quartile |
| Around 3.48% | Median |
| Above 4.91% | Top quartile |
| Above 7.26% | Top 10% |
Short-form YouTube engagement benchmarks
| Channel-level median engagement | Position in this sample |
|---|---|
| Below 1.14% | Bottom quartile |
| Around 2.71% | Median |
| Above 4.55% | Top quartile |
| Above 6.67% | Top 10% |
This gives us a more defensible answer than calling one percentage universally "good."
For recent videos in this OverseerOS sample:
3% to 4% was broadly normal, 5% was strong, and around 7% was exceptional enough to place a channel near the top decile.
But format matters.
A 2% engagement rate means something different for long-form than for short-form.
And, as we will see, reach matters too.
Finding 1: Long-Form Median Engagement Was 3.48%
Across 246 long-form channels, the channel-weighted distribution was:
| Percentile | Engagement rate |
|---|---|
| 10th | 0.26% |
| 25th | 2.22% |
| 50th | 3.48% |
| 75th | 4.91% |
| 90th | 7.26% |
The middle 50% of long-form channels therefore sat between approximately:
2.2% and 4.9%
That range is much more useful than a single platform-wide average.
If your recent long-form videos consistently sit around:
3.5%
you are approximately near the middle of this sample.
Around:
5%
puts you near or above the upper quartile.
Around:
7.3%
places you near the top decile.
Again, those are descriptive positions within this sample.
They are not YouTube algorithm thresholds.
YouTube does not give a video an automatic distribution boost because it crosses exactly 5% engagement.
Finding 2: Short-Form Median Engagement Was Lower at 2.71%
Across 152 short-form channels, the channel-weighted median was:
2.71%
The distribution was:
| Percentile | Engagement rate |
|---|---|
| 10th | 0.07% |
| 25th | 1.14% |
| 50th | 2.71% |
| 75th | 4.55% |
| 90th | 6.67% |
The short-form distribution was wider near the bottom.
Some channels generated very low visible interaction relative to views.
Yet the upper benchmark was surprisingly close to long-form.
Top quartile:
- Long-form: 4.91%
- Short-form: 4.55%
Top decile:
- Long-form: 7.26%
- Short-form: 6.67%
So if you want one simple cross-format rule from this dataset:
5% visible engagement per view was strong in both groups.
The median is where format matters more.
Finding 3: Bigger Channels Did Not Automatically Have Lower View-Based Engagement
A common intuition is:
Smaller channels have higher engagement. Bigger channels have lower engagement.
That can be true when the denominator is subscribers.
But this study measures engagement against actual video views.
That changes the relationship.
Long-form engagement by subscriber size
| Subscriber snapshot | Channels | Videos | Median engagement | Middle 50% |
|---|---|---|---|---|
| Under 10K | 39 | 190 | 3.41% | 1.10% to 6.19% |
| 10K to 99K | 56 | 372 | 3.44% | 2.18% to 5.20% |
| 100K to 999K | 76 | 371 | 3.66% | 2.44% to 5.61% |
| 1M+ | 75 | 339 | 3.33% | 2.34% to 4.00% |
That is remarkably flat.
From roughly 10,000 subscribers to more than 1 million, the long-form medians stayed around:
3.3% to 3.7%
The rank correlation between subscriber count and channel-level long-form engagement was only:
-0.058
That is extremely weak.
Short-form engagement by subscriber size
| Subscriber snapshot | Channels | Videos | Median engagement | Middle 50% |
|---|---|---|---|---|
| Under 10K | 45 | 319 | 1.71% | 0.54% to 3.19% |
| 10K to 99K | 18 | 125 | 2.20% | 1.81% to 3.33% |
| 100K to 999K | 41 | 299 | 3.26% | 1.31% to 4.50% |
| 1M+ | 48 | 236 | 3.80% | 1.56% to 4.90% |
Short-form did not show the expected decline either.
Its rank correlation with subscriber count was:
+0.182
still weak, but positive rather than negative.
Why the denominator changes everything
Consider:
Engagement by subscribers
(engagements ÷ subscribers)
versus:
Engagement by views
(engagements ÷ views)
A large channel may have millions of subscribers, but only a fraction may watch a particular video.
Using subscribers in the denominator penalizes that channel for inactive or non-viewing subscribers.
Using views asks a different question:
Of the viewing activity this video generated, how much visible interaction came with it?
Our data suggests channel size becomes far less important when engagement is calculated that way.
Finding 4: Likes Dominated the Engagement Rate
"Engagement" sounds like one thing.
It is not.
Likes and comments behaved very differently.
Long-form
Channel-weighted median like rate:
3.11%
Channel-weighted median comment rate:
0.238%
Short-form
Median like rate:
2.60%
Median comment rate:
0.032%
That means most of the combined engagement-rate number came from likes.
The comment benchmark was dramatically smaller.
What Is a Good YouTube Like Rate?
For long-form channels:
| Percentile | Like rate |
|---|---|
| 25th | 1.96% |
| Median | 3.11% |
| 75th | 4.54% |
| 90th | 6.47% |
For short-form:
| Percentile | Like rate |
|---|---|
| 25th | 0.99% |
| Median | 2.60% |
| 75th | 4.37% |
| 90th | 6.45% |
The upper ends are remarkably similar.
A like rate around:
4.5%
was top-quartile territory.
Around:
6.5%
was near the top decile for both format groups.
What Is a Good YouTube Comment Rate?
Comments were much rarer.
Long-form comment rate
| Percentile | Comment rate |
|---|---|
| 25th | 0.116% |
| Median | 0.238% |
| 75th | 0.440% |
| 90th | 0.789% |
A median long-form comment rate of:
0.238%
means roughly:
2.4 comments per 1,000 views
At the 75th percentile:
4.4 comments per 1,000 views
At the 90th percentile:
7.9 comments per 1,000 views
That is useful context.
Creators can look at a video with 100,000 views and "only" 250 comments and think the conversation is weak.
That would be:
0.25%
which is approximately around the long-form median in this sample.
Short-form comment rate
The short-form numbers were substantially lower:
| Percentile | Comment rate |
|---|---|
| 25th | 0.000% |
| Median | 0.032% |
| 75th | 0.119% |
| 90th | 0.264% |
Median:
0.32 comments per 1,000 views
This shows why combining likes and comments into one number can hide meaningful differences in viewer behavior.
Two videos can both have 4% total engagement while producing very different kinds of interaction.
Finding 5: The Pooled Long-Form vs Short-Form Comparison Was Misleading
If we stop at the full sample, long-form appears to win.
Overall channel-weighted medians:
- Long-form: 3.48%
- Short-form: 2.71%
That looks straightforward.
But different channels make different formats.
So we performed a more controlled comparison.
We isolated:
89 channels
that had qualifying videos in both format groups during the same research cohort.
Those channels contributed:
- 317 long-form videos
- 464 short-form videos
Then we compared each channel against itself.
The result changed.
Matched-channel engagement
| Metric | Long-form | Short-form |
|---|---|---|
| Median total engagement | 3.08% | 3.46% |
| Median like rate | 2.75% | 3.37% |
| Median comment rate | 0.182% | 0.056% |
Short-form had the higher combined engagement median in:
52 of 89 channels
or:
58.4%
The median short-form-to-long-form engagement ratio was:
1.08×
That is only an 8% difference.
So the correct conclusion is not:
Short-form always gets higher engagement.
It is:
The format comparison depends heavily on which channels you compare, and once the same channels were compared, the large pooled advantage for long-form disappeared.
But comments still told a different story
Within the same channels:
Long-form median comment rate:
0.182%
Short-form:
0.056%
Short-form's stronger combined engagement came primarily from likes.
Long-form generated substantially more comments per view.
That is strategically important.
If your goal is:
visible low-friction interaction
likes may tell more of the story.
If your goal is:
conversation and deeper response
comment rate deserves its own benchmark.
Do not compress everything into one engagement score.
Finding 6: Engagement Was Surprisingly Stable From Day 7 to Day 30
We restricted the main cohort to 7-to-30-day-old videos.
But that is still a 23-day window.
So we split it again.
Long-form
| Video age | Channel-weighted median engagement |
|---|---|
| 7 to 13 days | 3.42% |
| 14 to 20 days | 3.38% |
| 21 to 30 days | 3.50% |
That is remarkably stable.
Short-form
| Video age | Channel-weighted median engagement |
|---|---|
| 7 to 13 days | 2.81% |
| 14 to 20 days | 2.53% |
| 21 to 30 days | 3.04% |
Short-form moved somewhat more, but there was no enormous age-driven collapse.
That makes the 7-to-30-day benchmark reasonably useful for broad comparison.
It still does not mean video age should be ignored.
For your own channel, measuring every video at the same checkpoint is cleaner.
For example:
Day 14 engagement rate
across your last ten long-form videos.
Consistency makes the comparison stronger.
Finding 7: Wider Reach Was Associated With Lower Engagement
This was one of the most interesting findings.
We already had same-day public subscriber snapshots for the videos in the cohort.
That allowed us to compare engagement with the video's:
views-to-subscriber ratio
This ratio does not tell us which viewers were subscribed.
It simply expresses how large the video's public view count was relative to the channel's public subscriber count.
We grouped videos into four reach bands.
Long-form
| Video views relative to subscribers | Channels | Videos | Channel-weighted median engagement |
|---|---|---|---|
| Under 5% | 100 | 393 | 3.56% |
| 5% to 20% | 118 | 342 | 3.60% |
| 20% to 100% | 113 | 339 | 3.16% |
| 100%+ | 76 | 198 | 2.05% |
Long-form videos with more views than the channel had subscribers showed a median engagement rate of only:
2.05%
compared with around:
3.6%
for videos with much narrower relative reach.
Short-form
The pattern was even stronger.
| Video views relative to subscribers | Channels | Videos | Channel-weighted median engagement |
|---|---|---|---|
| Under 5% | 70 | 272 | 3.80% |
| 5% to 20% | 62 | 157 | 3.16% |
| 20% to 100% | 75 | 246 | 2.53% |
| 100%+ | 63 | 304 | 1.33% |
Short-form videos with views exceeding subscriber count had a median engagement rate of:
1.33%
The narrowest-reach group had:
3.80%
That is almost three times higher.
A Lower Engagement Rate Can Appear on a Bigger Winner
This finding changes how creators should diagnose engagement.
Imagine:
Video A
- 100,000 subscribers
- 10,000 views
- 500 likes + comments
- engagement: 5%
Video B
- 100,000 subscribers
- 500,000 views
- 12,500 likes + comments
- engagement: 2.5%
Video A has twice the engagement rate.
Video B has:
- 50 times more views
- 25 times more visible engagement
- vastly more total reach
Which performed better?
You cannot answer that from engagement rate alone.
The lower percentage may coexist with dramatically greater distribution.
One plausible explanation is audience broadening.
A video initially resonating with a creator's most committed viewers may generate a high interaction rate.
As it reaches increasingly broad audiences, a smaller percentage of viewers may choose to like or comment.
But this study is observational.
We cannot prove that broader distribution caused the lower engagement rate.
The safe conclusion is:
High reach and high engagement rate are not the same outcome, and a video can gain enormous relative reach while its visible engagement percentage declines.
That is why engagement should never be used as the only channel-health metric.
For the companion analysis of reach relative to audience size, see our YouTube views-to-subscriber ratio study.
Finding 8: The Benchmark Survived Different Recency Cutoffs
Our main cohort uses the newest 20 captured uploads per channel.
We reran the analysis using:
- newest 10
- newest 20
- newest 30
Long-form median engagement
| Recency cutoff | Median engagement |
|---|---|
| Newest 10 | 3.58% |
| Newest 20 | 3.48% |
| Newest 30 | 3.51% |
Almost unchanged.
Short-form median engagement
| Recency cutoff | Median engagement |
|---|---|
| Newest 10 | 2.79% |
| Newest 20 | 2.71% |
| Newest 30 | 2.56% |
Short-form moved slightly more, but the overall interpretation stayed intact.
That makes us more confident that the primary benchmark is not an artifact of choosing exactly 20 recent videos.
Is 1% Engagement Good on YouTube?
It depends on format and context.
For long-form, the 25th percentile of channel-level medians was:
2.22%
So a sustained 1% long-form engagement rate would sit below the lower quartile of this sample.
For short-form, the 25th percentile was:
1.14%
So 1% was much closer to the lower quartile.
But that still does not make 1% automatically "bad."
If the video is generating extraordinary reach, the engagement percentage can be lower while the absolute interaction volume is much larger.
Diagnose the full performance picture.
Is 2% Engagement Good on YouTube?
For long-form:
2% was below the sample median and close to the lower quartile.
For short-form:
2% was below the 2.71% median but well above the lower quartile.
So 2% is not a universal red flag.
It is better described as:
below typical long-form engagement in this sample, but still inside the normal short-form distribution.
Is 3% Engagement Good on YouTube?
A 3% engagement rate was close to the middle of this dataset.
Long-form median:
3.48%
Short-form median:
2.71%
So 3% is a reasonable "typical" benchmark for recent public YouTube videos in this cohort.
It is not exceptional.
It is also not weak by default.
Is 5% Engagement Good on YouTube?
Yes, relative to this sample.
A 5% channel-level median was:
- above the 75th percentile for long-form
- above the 75th percentile for short-form
The 75th-percentile thresholds were:
- Long-form: 4.91%
- Short-form: 4.55%
So 5% is a strong public engagement benchmark for both formats in this study.
Is 10% Engagement Good on YouTube?
A sustained 10% channel-level median would be unusually high relative to this sample.
The 90th-percentile benchmarks were only:
- 7.26% long-form
- 6.67% short-form
So 10% would sit beyond the top-decile threshold.
That does not mean every individual 10% video is extraordinary.
Small-view videos can produce volatile percentages.
A video with:
- 20 views
- 2 likes
already has:
10%
which is obviously a very different signal from:
- 1,000,000 views
- 100,000 interactions
Always look at sample size and view volume.
A Better Way to Benchmark Your YouTube Engagement
The best benchmark is not the internet average.
It is a hierarchy.
1. Compare against your own recent videos
Take your last:
10 to 20 comparable uploads
Use the same format.
Measure them at roughly the same video age.
Calculate:
(likes + comments) ÷ views × 100
Then take the median.
That becomes your baseline.
2. Separate long-form and short-form
Our matched-channel analysis showed why.
The same creators produced different:
- like rates
- comment rates
- total engagement
across formats.
Do not compare them blindly.
3. Separate likes from comments
A 4% engagement rate can come from:
3.95% likes + 0.05% comments
or:
3.2% likes + 0.8% comments
Those are different audience behaviors.
Track:
- like rate
- comment rate
- combined engagement
separately.
4. Look at reach
If engagement falls while views explode, do not automatically diagnose the video as weaker.
Check:
- total views
- views relative to channel baseline
- views-to-subscriber ratio
- velocity
A lower engagement percentage can coexist with much broader reach.
5. Investigate unusual videos
The metric should lead to a question.
Not a judgment.
If one video has unusually high engagement, ask:
- What topic did it cover?
- What did the title promise?
- Did the thumbnail attract a specific audience?
- Did the creator ask a polarizing question?
- Was there an emotional moment worth commenting on?
- Was the subject identity-driven?
- Did viewers have something obvious to add?
That is where the number becomes useful.
Engagement Rate vs Views-to-Subscriber Ratio
These two metrics answer different questions.
Engagement rate
(likes + comments) ÷ views
asks:
How much visible interaction came with the video's views?
Views-to-subscriber ratio
video views ÷ channel subscribers
asks:
How large was the video's public reach relative to the channel's subscriber base?
A video can have:
- high engagement, low reach
- low engagement, high reach
- high engagement, high reach
- low engagement, low reach
That is why both metrics are useful together.
Our separate analysis of 2,043 recent videos found that views relative to subscriber count vary dramatically by channel size.
The current study adds another layer:
the widest relative reach was associated with lower visible engagement rates.
Neither metric should replace the other.
Engagement Rate vs YouTube VPH
VPH answers another question entirely.
Views per hour asks:
How quickly is this video accumulating views?
Engagement rate asks:
How frequently are those viewers visibly interacting?
A video can be moving extremely fast while producing a modest engagement percentage.
Or it can move slowly while generating intense interaction from a small audience.
Our YouTube VPH study showed why raw velocity also needs a channel-relative baseline.
Together, these metrics give you three different views of performance:
| Metric | What it tells you |
|---|---|
| Engagement rate | Viewer interaction relative to views |
| Views-to-subscriber ratio | Reach relative to channel size |
| Relative VPH | Velocity relative to channel baseline |
That is much more useful than asking whether one isolated number is "good."
How to Analyze YouTube Engagement With OverseerOS
The simplest workflow is to move from benchmark to context.
1. Analyze the channel
Use the OverseerOS AI YouTube Channel Analyzer to inspect a public channel's recent and top-performing videos.
The goal is not to stare at one engagement number.
Look at the channel around it.
2. Find unusually strong channels
Use the OverseerOS Viral Channel Finder to find emerging and breakout channels rather than researching only the biggest established creators.
Our 167-channel breakout study showed why smaller channels can be valuable research targets.
3. Compare recent videos
For each competitor, look at:
- views
- likes
- comments
- recency
- format
- relative performance
Find the uploads that break the channel's normal pattern.
4. Separate reach from engagement
A huge view outlier with moderate engagement can still be strategically important.
A modest-view video with extreme engagement can reveal a deeply resonant topic.
They are different signals.
5. Reverse-engineer the reason
Once you identify an unusual video, investigate:
- topic
- title
- thumbnail
- hook
- audience promise
- emotional trigger
- format
- timing
The purpose of analytics is not to collect percentages.
It is to identify what deserves investigation next.
YouTube Engagement Benchmark Cheat Sheet
For recent public videos measured between 7 and 30 days after publication:
| Metric | Long-form | Short-form ≤3 min |
|---|---|---|
| Lower quartile engagement | 2.22% | 1.14% |
| Median engagement | 3.48% | 2.71% |
| Top quartile engagement | 4.91% | 4.55% |
| Top decile engagement | 7.26% | 6.67% |
| Median like rate | 3.11% | 2.60% |
| Median comment rate | 0.238% | 0.032% |
If you want one rule to remember:
Around 3% is typical. Around 5% is strong. Around 7% is top-decile territory in this sample.
Then add the context:
format + reach + your own baseline.
The Engagement Rate Mistakes to Avoid
Before diagnosing a video, check that you are not making one of these mistakes:
- Comparing engagement by subscribers with engagement by views
- Mixing Shorts and long-form into one benchmark
- Comparing a one-day-old video with a 30-day-old video
- Using an arithmetic average when one extreme video dominates
- Assuming every like and comment represents a unique viewer
- Treating high engagement as proof of high reach
- Treating lower engagement as proof that a viral video is weak
- Ignoring raw view volume
- Ignoring comment rate because combined engagement looks healthy
- Treating a descriptive benchmark as an algorithm threshold
The number only becomes useful after the denominator and comparison group are clear.
Limitations
This research has important limitations.
First, this is an OverseerOS observational sample, not a random sample of every YouTube video.
The channels entered the research corpus through public channel-analysis activity. They may differ from YouTube as a whole.
Second, the study uses public engagement signals.
We can observe:
- views
- likes
- comments
We cannot publicly observe another channel's:
- impressions
- click-through rate
- unique viewers
- watch time
- audience retention
- shares
- saves
- subscriber conversion
- recommendation traffic
- returning-viewer rate
So this is specifically a public visible-engagement benchmark.
Third, comments can be affected by moderation and channel settings.
A low public comment count does not always mean viewers had no desire to comment.
Fourth, public views can include multiple views from the same viewer.
The denominator is views, not unique viewers.
Fifth, our short-form classification uses video duration.
Videos of 3 minutes or less are grouped as short-form, but this should not be interpreted as a perfect identification of every video's YouTube Shorts distribution surface.
Sixth, multiple videos came from the same channels.
Our primary benchmarks address this by calculating channel medians before group percentiles.
Seventh, subscriber counts are same-day public snapshots rather than publication-time subscriber counts.
This matters particularly for the views-to-subscriber reach analysis.
Finally, all findings are observational.
The study does not prove that:
- high engagement causes more views
- lower engagement causes broader reach
- likes cause recommendations
- comments cause recommendations
- channel size has no effect on audience behavior
It describes what appeared together in this sample.
Final Verdict
What is a good YouTube engagement rate?
For public engagement calculated as:
(likes + comments) ÷ views × 100
our analysis of 2,251 recent videos across 309 channels found:
Long-form
- Median: 3.48%
- Top quartile: 4.91%+
- Top decile: 7.26%+
Short-form videos of 3 minutes or less
- Median: 2.71%
- Top quartile: 4.55%+
- Top decile: 6.67%+
That makes a practical benchmark:
Around 3% is normal, 5% is strong, and 7% is exceptional relative to this sample.
But the deeper findings matter more.
Long-form engagement by views barely changed across subscriber tiers.
Short-form and long-form showed very different comment behavior.
Comparing the same 89 channels changed the apparent format winner.
And videos with the widest reach relative to subscriber count had some of the lowest engagement rates.
So do not optimize for engagement percentage in isolation.
Ask three questions:
How much interaction did the video generate?
How much reach did it generate?
How unusual is both of that for this channel?
That is the benchmark that actually helps you make better videos.
FAQ
What is a good YouTube engagement rate?
In the OverseerOS study of 2,251 recent videos, the channel-weighted median engagement rate was 3.48% for long-form and 2.71% for short-form videos of 3 minutes or less. Around 5% was above the 75th percentile in both groups.
How do you calculate YouTube engagement rate?
For public video analysis:
YouTube engagement rate = (likes + comments) ÷ views × 100
A video with 50,000 views, 1,500 likes, and 250 comments has a 3.5% visible engagement rate.
Is 3% engagement good on YouTube?
A 3% rate was close to typical in this dataset. The median was 3.48% for long-form and 2.71% for short-form videos of 3 minutes or less.
Is 5% engagement good on YouTube?
Yes. A 5% channel-level median was above the 75th percentile for both formats in this study. The top-quartile thresholds were 4.91% for long-form and 4.55% for short-form.
Is 10% engagement good on YouTube?
A sustained 10% median would be unusually high relative to this dataset. The 90th-percentile benchmarks were 7.26% for long-form and 6.67% for short-form.
What is a good YouTube like rate?
The channel-weighted median like rate was 3.11% for long-form and 2.60% for short-form. Around 4.5% was top-quartile territory, while approximately 6.5% was near the top decile.
What is a good YouTube comment rate?
The median long-form comment rate was 0.238%, or about 2.4 comments per 1,000 views. The median short-form rate was much lower at 0.032%.
Does YouTube engagement rate decrease as channels get bigger?
Not clearly when engagement is measured against views. In this sample, long-form median engagement stayed between 3.33% and 3.66% across subscriber tiers from under 10K to 1M+. The relationship between subscriber count and view-based engagement was weak.
Do YouTube Shorts have higher engagement than long-form videos?
Not according to a simple universal rule. The pooled sample showed higher long-form engagement, but when we compared the same 89 channels, short-form had a median engagement rate of 3.46% versus 3.08% for long-form. Long-form still had a much higher comment rate.
Why does my engagement rate fall when a video goes viral?
A wider audience can coincide with lower visible interaction per view. In this study, videos whose views exceeded their channel's subscriber count had lower median engagement rates than videos with narrower relative reach. This is an association, not proof that broader reach causes engagement to fall.
Should I calculate engagement using views or subscribers?
It depends on the question. Engagement divided by views measures interaction relative to actual video consumption. Engagement divided by subscribers measures interaction relative to the channel's audience size. They are different metrics and should not use the same benchmark.
Do likes and comments count the same?
They can be added together for a simple public engagement-rate calculation, but they represent different behaviors. In this study, likes were much more common than comments, especially on short-form videos.
What is the best YouTube engagement benchmark?
Use your own recent comparable videos first. Compare the same format at a similar video age, use the median across several uploads, then compare with channels of similar context. Public benchmarks are best used as reference points, not universal pass-or-fail scores.