A good YouTube like-to-view ratio for a mature long-form video is roughly 3%, based on OverseerOS data.
We analyzed 3,292 mature long-form videos across 89 public YouTube channels with positive public like counts.
The distribution was:
- 10th percentile: 1.14%
- 25th percentile: 1.84%
- Median: 2.92%
- 75th percentile: 4.36%
- 90th percentile: 6.40%
So a practical research benchmark is:
| Like-to-view ratio | How it ranked in this study |
|---|---|
| Below 1% | Very low relative to this cohort |
| 1% to 2% | Below typical |
| 2% to 3% | Around the lower-middle range |
| 3% to 4.4% | Around or above median |
| 4.4%+ | Top quarter |
| 6.4%+ | Top 10% |
But there is a major catch.
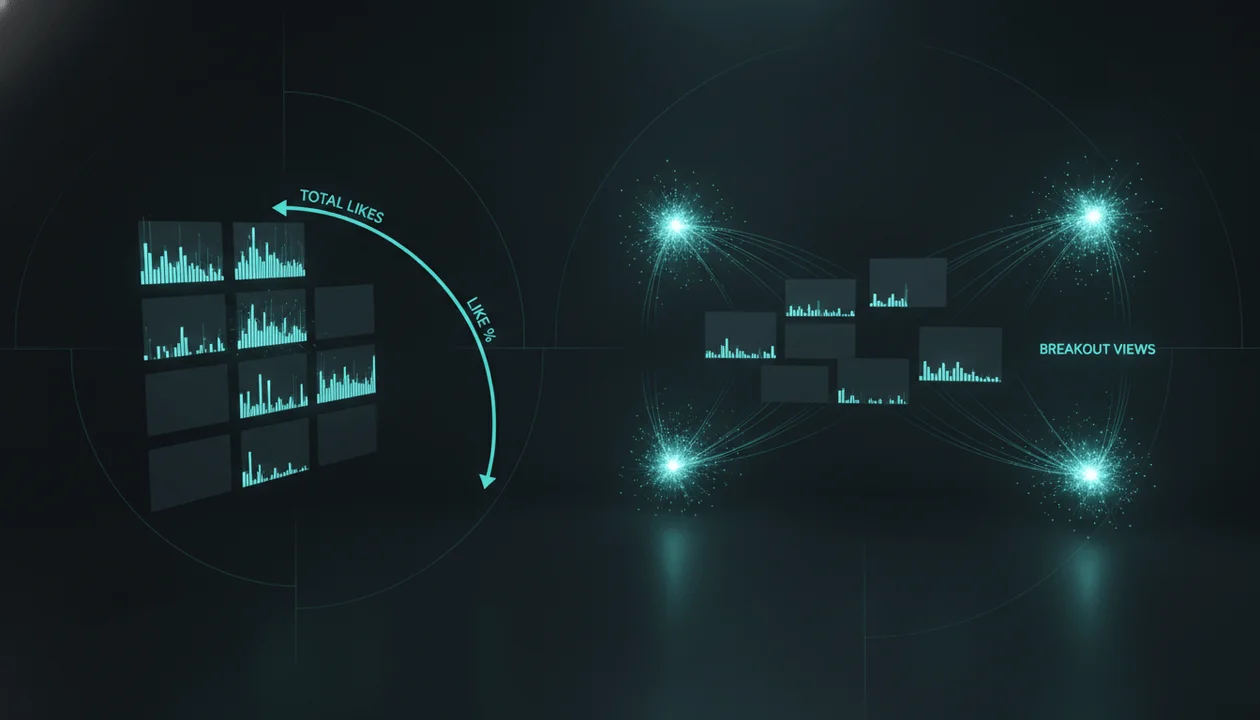
Higher like ratios did not mean higher-performing videos.
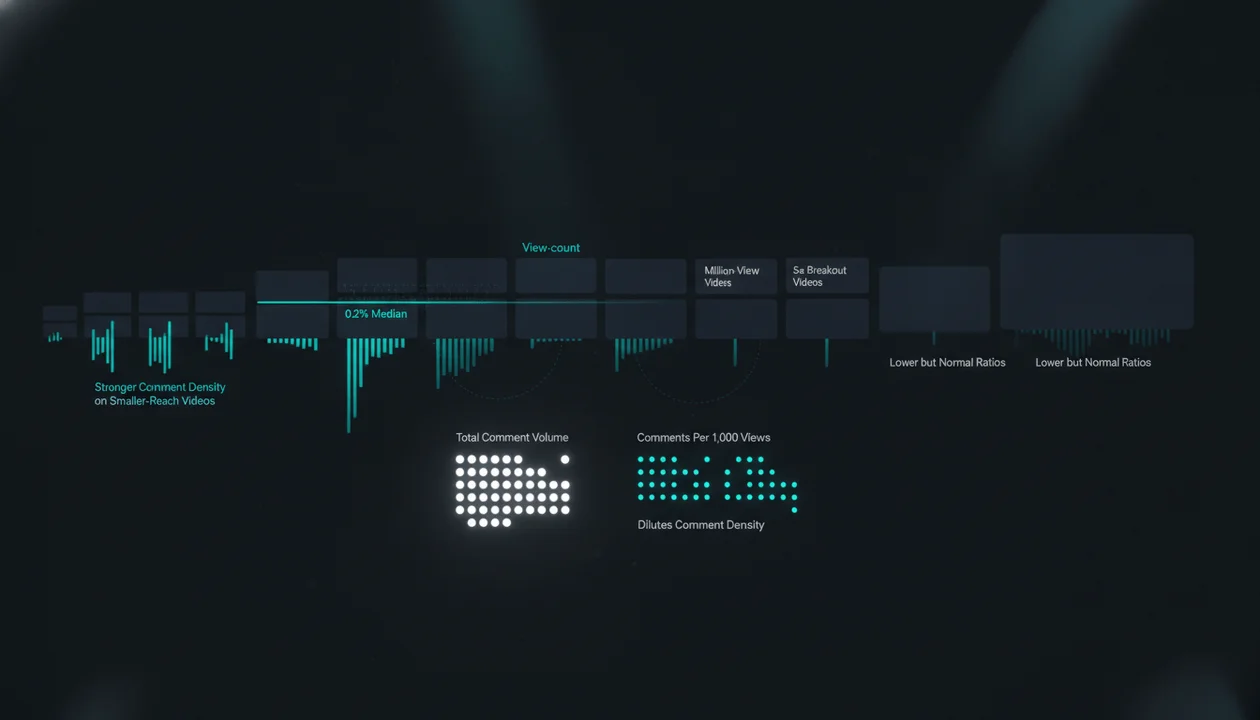
In fact, videos with millions of views tended to have lower like-to-view ratios than videos with smaller audiences.
And 5x channel outliers had a median like rate of:
2.41%
while videos performing below their channel-year baseline had a higher median of:
3.28%.
That does not mean likes hurt a video's performance.
It means:
Like-to-view ratio is an engagement-context metric, not a direct virality score.
As a video reaches a broader audience, its view denominator can expand much faster than its likes.
So the best question is not:
“Is my like ratio above 5%?”
It is:
“Is this ratio normal for videos of this size, age, format, and channel, and is the video outperforming my usual reach?”
Key Findings
| Finding | OverseerOS result |
|---|---|
| Mature long-form videos analyzed | 3,292 |
| Public channels | 89 |
| Minimum video age | 90 days |
| 10th percentile like-to-view ratio | 1.14% |
| 25th percentile | 1.84% |
| Median | 2.92% |
| Mean | 3.53% |
| 75th percentile | 4.36% |
| 90th percentile | 6.40% |
| Videos at 1%+ | 92.1% |
| Videos at 2%+ | 71.4% |
| Videos at 3%+ | 48.5% |
| Videos at 4%+ | 29.6% |
| Videos at 5%+ | 18.7% |
| Videos at 7.5%+ | 6.0% |
| Videos at 10%+ | 2.3% |
| Equal-channel median | 2.91% |
| Recent 90-730 day median | 3.03% |
The cleanest takeaway is:
Around 3 likes per 100 views was typical in this mature long-form sample.
What Is a YouTube Like-to-View Ratio?
The formula is:
Like-to-view ratio =
Likes
÷
Views
×
100
Example:
A video has:
100,000 views
and:
3,000 likes.
Then:
3,000 ÷ 100,000 × 100
=
3%
The video's public like-to-view ratio is:
3%.
You can also express it as:
30 likes per 1,000 views.
Is a 3% Like-to-View Ratio Good on YouTube?
In this study:
yes, roughly average to slightly above average.
The median was:
2.92%.
So a mature long-form video at:
3%
was almost exactly at the center of the 3,292-video distribution.
But do not interpret that as:
YouTube rewards videos after they hit 3%.
This study does not show that.
It simply tells you:
3% was a normal public engagement ratio for the mature videos we analyzed.
Is a 5% Like-to-View Ratio Good?
Yes.
A 5% ratio means:
5 likes
for every
100 views
Only:
18.7%
of videos in the study reached at least 5%.
So 5% sat comfortably above the median.
It was above the:
75th-percentile benchmark of 4.36%.
That makes 5% a strong descriptive result in this dataset.
But again:
strong engagement ratio does not automatically mean strong reach.
A video with:
- 5,000 views
- 400 likes
has an:
8% like rate.
A video with:
- 1,000,000 views
- 25,000 likes
has:
2.5%.
The second video reached:
200x more viewers/views
despite having a much lower ratio.
Is a 10% Like-to-View Ratio Good?
It is unusually high in this dataset.
Only:
2.3%
of qualifying mature videos had a like-to-view ratio of:
10% or higher.
So 10% was rare.
But rare does not automatically mean:
better video
or:
more viral.
High ratios can occur on videos with:
- Small but passionate audiences
- Loyal fan communities
- Strong calls to action
- Highly emotional topics
- Low total reach
- Early audience concentration
A 10% ratio is impressive engagement.
It is not proof of broad distribution.
What Percentage of YouTube Viewers Like a Video?
Be careful with that wording.
A video's public like-to-view ratio is not necessarily the literal percentage of unique viewers who liked it.
Views and viewers are different metrics.
A video can receive repeat views.
A person's like is associated with their account interaction, while the public view total represents counted views.
So it is more accurate to say:
The video received X likes for every 100 public views.
Not:
X% of all unique viewers liked the video.
Finding 1: The Median YouTube Like Rate Was 2.92%
Across all:
3,292 videos
the median was:
2.92%.
That means half of the videos were above roughly:
29 likes per 1,000 views
and half were below.
The mean was higher:
3.53%.
That difference matters.
Why?
Because engagement ratios are skewed.
A smaller number of very high-like-rate videos pull the average upward.
That is why the:
median
is the better general benchmark here.
The Like-to-View Distribution
| Percentile | Like-to-view ratio | Likes per 1,000 views |
|---|---|---|
| 10th | 1.14% | 11.4 |
| 25th | 1.84% | 18.4 |
| Median | 2.92% | 29.2 |
| 75th | 4.36% | 43.6 |
| 90th | 6.40% | 64.0 |
This gives creators a much better benchmark than:
“Anything above 4% is good.”
The answer depends on where your video sits in the distribution.
A Practical YouTube Like-Rate Benchmark
For mature long-form videos similar to this study:
Below 1%
Low relative to the cohort.
Not automatically bad.
High-reach videos can have lower ratios.
1% to 2%
Below median.
Still extremely common.
2% to 3%
Normal territory.
3% to 4.4%
Above the overall median.
4.4% to 6.4%
Top quarter territory.
Above 6.4%
Top 10% territory.
10%+
Rare in this cohort.
Only about:
1 in 43 videos
reached it.
Finding 2: Like Rate Fell as View Count Increased
This was one of the most important findings.
We divided videos by their current public view count.
| Video views | Videos | Channels | 25th percentile | Median | 75th percentile |
|---|---|---|---|---|---|
| Under 10K | 979 | 53 | 2.35% | 3.54% | 5.81% |
| 10K-100K | 807 | 70 | 2.13% | 3.38% | 4.83% |
| 100K-1M | 888 | 72 | 1.74% | 2.49% | 3.72% |
| 1M+ | 618 | 55 | 1.44% | 2.17% | 3.08% |
The pattern is clear.
Videos under 10K views
Median:
3.54%.
Million-view videos
Median:
2.17%.
So the million-view group had a substantially lower typical like ratio.
Does That Mean High Like Rates Reduce Views?
No.
Absolutely not.
This is observational data.
The relationship can arise for many reasons.
One plausible explanation is:
Broader distribution dilutes engagement density.
Imagine a creator's core audience.
They may be:
- More loyal
- More interested
- More likely to like
- More familiar with the creator
As the video expands to:
- Casual viewers
- Suggested traffic
- Search traffic
- New viewers
- Broader Browse audiences
the denominator can grow faster than active engagement.
That could lower:
likes per view
while dramatically increasing total views.
But we cannot prove that mechanism from public data alone.
More Views Can Lower the Ratio Even While Likes Explode
Consider this example.
Early audience
Views:
10,000
Likes:
600
Like rate:
600 ÷ 10,000 = 6%
Now the video breaks out.
Later
Views:
1,000,000
Likes:
30,000
Like rate:
30,000 ÷ 1,000,000 = 3%
Total likes increased from:
600
to:
30,000.
That is a:
50x increase in likes.
Yet the ratio fell from:
6% to 3%.
So a falling ratio does not necessarily mean:
people like the video less.
It can mean:
reach expanded faster than likes.
Finding 3: Views and Like Rate Had a Negative Correlation
Across the mature cohort, the correlation between:
log view count
and:
like-to-view ratio
was:
-0.380.
That is a moderate negative descriptive relationship.
In the recent 90-to-730-day sensitivity cohort, it was:
-0.399.
So the same direction remained after restricting the analysis to newer videos.
This reinforces the warning:
Do not use like rate as a simple proxy for view potential.
Finding 4: Viral Outliers Did Not Have the Highest Like Rates
This may be the most counterintuitive result.
We compared each video's views with the median views of other videos from:
- The same channel
- The same publication year
Then we grouped videos by relative performance.
| Channel-relative performance | Videos | Median like rate |
|---|---|---|
| Below 1x baseline | 1,475 | 3.28% |
| 1x-2x | 836 | 2.81% |
| 2x-5x | 426 | 2.36% |
| 5x+ | 317 | 2.41% |
Read that again.
Videos performing below baseline had a median like rate of:
3.28%.
5x+ breakouts:
2.41%.
So the videos with the strongest relative reach did not have the strongest engagement ratio.
Why This Matters
Imagine you publish two videos.
Video A
10,000 views.
Like rate:
5%.
Video B
100,000 views.
Like rate:
2.5%.
If your normal video gets:
15,000 views
then Video B is clearly the larger audience success.
Judging only by like rate would make you prefer Video A.
That could send your content strategy in the wrong direction.
A High Like Rate Can Hide Weak Reach
Suppose a video gets:
2,000 views
and:
200 likes.
Like rate:
10%.
Excellent engagement density.
But the channel normally receives:
30,000 views.
The video is still a major reach underperformer.
You need both metrics.
A Lower Like Rate Can Hide a Breakout
Suppose:
Normal channel views:
20,000.
New video:
200,000.
Relative performance:
200K ÷ 20K = 10x
Like rate:
2%.
That 2% may look unimpressive against a generic:
5% is good
rule.
But the video expanded:
10x beyond normal reach.
That is likely far more strategically valuable.
The Better Two-Axis Framework
Judge videos on:
Axis 1: Reach
How far did the video travel?
Use:
- Views
- Channel-relative multiple
- Fixed-age views
- Outlier performance
Axis 2: Engagement density
How much visible engagement occurred per view?
Use:
- Like-to-view ratio
- Comment-to-view ratio
- Other first-party engagement signals
Now you can distinguish four situations.
High Reach + High Like Rate
Potentially exceptional.
The video expands while maintaining strong engagement density.
High Reach + Lower Like Rate
Can still be an excellent breakout.
Broad audiences may engage at lower rates.
Low Reach + High Like Rate
Strong core-audience response, weak distribution.
Worth studying.
Low Reach + Low Like Rate
Potentially weak topic, weak audience fit, weak packaging, weak satisfaction, or some combination.
No single public metric tells you which.
Finding 5: A 3% Like Rate Was More Common Than a 5% Rate
Thresholds across all 3,292 videos:
| Like ratio threshold | Share of videos reaching it |
|---|---|
| ≥1% | 92.1% |
| ≥2% | 71.4% |
| ≥3% | 48.5% |
| ≥4% | 29.6% |
| ≥5% | 18.7% |
| ≥7.5% | 6.0% |
| ≥10% | 2.3% |
This makes:
3%
a particularly useful reference point.
Almost exactly half of the videos:
48.5%
reached 3% or better.
That aligns closely with the:
2.92% median.
Is 1% Like-to-View Ratio Bad?
It was low relative to this cohort.
More than:
92%
of videos exceeded 1%.
But you should still avoid calling every video below 1%:
bad.
The ratio can be affected by:
- Massive broad reach
- Topic type
- Audience type
- Video age
- Content format
- Whether viewers feel motivated to interact
- Creator calls to action
A low ratio deserves context.
Not panic.
Is 2% Good?
2% was below the median but far from unusual.
About:
71.4%
of videos reached at least 2%.
For videos above:
1 million views
the median was only:
2.17%.
So 2% on a giant breakout can be perfectly ordinary.
Is 4% Good?
Yes, relative to this mature sample.
Only:
29.6%
of videos reached 4%+.
That puts 4% around the upper third.
The 75th percentile was:
4.36%.
Is 5% Good?
Strong.
Roughly:
18.7%
of videos reached at least 5%.
But the view-scale context matters.
For sub-10K-view videos:
the 75th percentile was:
5.81%.
For million-view videos:
the 75th percentile was only:
3.08%.
So 5% means very different things at different reach levels.
What Is a Good Like-to-View Ratio for a Viral Video?
In our 5x+ channel-relative breakout group:
the median was:
2.41%.
That is probably the most useful answer.
A viral or breakout video does not need:
- 5%
- 8%
- 10%
likes per view to be performing unusually well.
In this dataset:
2.41%
was typical among the strongest 5x+ relative outliers.
That is lower than the overall:
2.92% median.
What Is a Good Like Rate for a Million-View Video?
Among:
618 videos with at least 1 million views
the like-rate distribution was:
25th percentile
1.44%.
Median
2.17%.
75th percentile
3.08%.
So for million-view long-form videos:
2% to 3%
was very normal in this cohort.
A:
5%
ratio would be unusually strong relative to this group.
What Is a Good Like Rate Under 100K Views?
For videos with:
10K-100K views
the median was:
3.38%.
25th percentile:
2.13%.
75th:
4.83%.
For videos below:
10K views
the median was even higher:
3.54%.
This supports the broader pattern:
Smaller-reach videos tended to generate more likes per view.
Finding 6: Equal-Channel Weighting Confirmed the Headline Benchmark
Some channels contributed many more videos than others.
So we also calculated:
each channel's median like rate
and then gave all:
89 channels
one equal vote.
Results:
25th percentile channel median
2.13%.
Median channel
2.91%.
75th percentile
4.06%.
The pooled-video median:
2.92%.
Equal-channel median:
2.91%.
Almost identical.
That is useful.
It means the main 3% benchmark was not simply created by a few prolific channels contributing hundreds of videos.
Finding 7: Recent Videos Produced Nearly the Same Benchmark
Older YouTube eras could behave differently.
So we restricted the analysis to mature videos between roughly:
90 and 730 days old.
That produced:
2,335 videos across 84 channels.
Results:
10th percentile
1.25%.
25th percentile
2.01%.
Median
3.03%.
75th percentile
4.37%.
90th percentile
6.32%.
Compare that with the full cohort:
2.92% median.
The recent cohort:
3.03%.
Very similar.
That strengthens the usefulness of:
roughly 3%
as a descriptive benchmark.
What Is a Good Like Rate in the First 24 Hours?
We also ran a separate exploratory analysis on recent long-form uploads with tracked snapshots close to:
24 hours after publication.
That cohort contained:
84 videos across 54 channels.
The median snapshot age was:
24.62 hours.
The first-day like-rate distribution was:
25th percentile
1.04%.
Median
1.54%.
75th percentile
2.49%.
90th percentile
3.46%.
That is lower than the mature-video benchmark.
Do Not Compare a 24-Hour Ratio With a Mature Ratio
This is critical.
If your brand-new upload has:
1.7%
after 24 hours, do not immediately compare it with the mature-study median of:
2.92%.
They are different lifecycle stages and different cohorts.
For a new upload, the 24-hour tracked sample gives the more relevant context.
For a mature upload:
use the mature sample.
Why Might Like Rate Change Over Time?
Several mechanisms are possible.
The study cannot establish which one dominates.
A video's audience composition can change.
Its traffic sources can change.
The people discovering it months later may behave differently from early viewers.
Public like and view totals also accumulate on different interaction patterns.
The key principle is:
Compare videos at similar ages whenever possible.
This is the same reason our first-24-hour YouTube views study uses fixed-age snapshots rather than mixing new and old videos.
Like Rate Is Not YouTube CTR
These are completely different metrics.
Click-through rate
Conceptually:
Thumbnail/title clicks
÷
Impressions
Like-to-view ratio
Likes
÷
Views
A video can have:
- Strong CTR
- Weak like ratio
or:
- Weak CTR
- High like ratio
They measure different stages.
CTR is primarily about:
getting the view.
Like rate happens:
after a view exists.
Do not use one as a substitute for the other.
Like Rate Is Not Retention
Same issue.
A viewer can watch:
90% of a video
and never click Like.
Another can watch two minutes, enjoy the point, and like immediately.
You cannot infer:
average percentage viewed
from:
likes/views.
They are separate behaviors.
Like Rate Is Not Audience Satisfaction
It can be one signal of positive engagement.
But it is not a complete measure of satisfaction.
A documentary can deeply satisfy viewers who rarely interact.
A highly partisan or identity-driven video can generate huge visible engagement.
A tutorial can solve someone's problem perfectly, then the viewer leaves without liking it.
Public engagement ratios should be treated as:
evidence
not:
truth about viewer satisfaction.
Does YouTube Reward Likes?
Public data cannot tell us how YouTube's internal recommendation systems weight one specific like.
Our study did not measure:
What happens to distribution if you add 1,000 likes while holding everything else constant?
So avoid claims such as:
Get to a 5% like rate and the algorithm pushes your video.
The dataset does not support that.
What we observed was actually the opposite of the simplistic expectation:
higher-performing outliers often had lower like density.
Should You Ask Viewers to Like the Video?
A like CTA can increase visible engagement if viewers respond.
But the strategic question is:
Does asking improve the viewer experience enough to justify the interruption?
A generic opening like:
Smash Like before we begin
asks for approval before delivering value.
A more natural CTA comes after:
- A useful insight
- A payoff
- A surprising result
- A meaningful section
For example:
If this breakdown helped you understand your analytics differently, liking the video helps me know to make more studies like this.
That connects the action with actual value.
But this study did not test CTA placement.
Do not treat the benchmark as proof that you need more like requests.
Why Small Loyal Audiences Can Have Huge Like Rates
Imagine:
1,000 dedicated viewers
who actively follow the creator.
The video gets:
1,200 views
and:
120 likes.
Like rate:
10%.
Now a breakout reaches:
100,000 people
including many casual viewers.
Likes rise to:
3,000.
That's:
25x more likes.
But the ratio falls to:
3%.
This is the engagement-dilution pattern creators need to understand.
A Falling Like Rate During a Breakout Can Be Normal
Suppose you check your video:
At 5K views
Like rate:
6%.
At 50K
4%.
At 500K
2.8%.
It is tempting to think:
The audience is rejecting it.
Maybe.
But another interpretation is:
YouTube is exposing it to progressively broader, colder audiences.
You need:
- Views
- Impressions
- CTR
- Retention
- Traffic source
- Audience mix
before diagnosing the cause.
The ratio alone is insufficient.
The Like-Rate Trap
A creator posts:
Video A
Views:
20K.
Like rate:
6%.
Then:
Video B
Views:
200K.
Like rate:
3%.
They decide:
My audience liked Video A twice as much.
That is not established.
Video B generated:
200,000 × 3%
=
6,000 likes
Video A:
20,000 × 6%
=
1,200 likes
Video B created:
5x more likes
and:
10x more views.
The lower ratio tells you about engagement density.
Not total impact.
The Better Like-Rate Diagnostic
Track four numbers together.
1. Fixed-age views
Example:
24-hour or 7-day views.
2. Relative view performance
Video views
÷
Median comparable-video views
3. Like-to-view ratio
Likes
÷
Views
4. Total likes
Do not throw away the numerator.
Then interpret the pattern.
Example A: Breakout With Dilution
Normal:
- 30K views
- 4% likes
New:
- 300K views
- 2.5% likes
Interpretation:
Huge reach expansion.
Engagement density fell.
Still potentially an excellent result.
Example B: Core-Audience Hit
Normal:
- 30K views
- 3%
New:
- 25K views
- 7%
Interpretation:
Audience that saw it engaged heavily.
Distribution did not expand.
Potentially a strong niche/core-audience signal.
Example C: Everything Improved
Normal:
- 30K
- 3%
New:
- 150K
- 5%
Interpretation:
Both reach and engagement density improved.
Worth deep analysis.
Example D: Everything Fell
Normal:
- 30K
- 3%
New:
- 10K
- 1%
Likely worth investigating:
- Topic
- Packaging
- Audience fit
- Content delivery
Still do not blame one metric without deeper analytics.
How Many Likes Should 1,000 Views Get?
Using the mature-video median:
about 29 likes per 1,000 views.
The quartile range was roughly:
18 to 44 likes per 1,000 views.
Top 10%:
64+ likes per 1,000.
So:
| Views | Median-study likes at 2.92% |
|---|---|
| 1,000 | 29 |
| 10,000 | 292 |
| 100,000 | 2,920 |
| 1,000,000 | 29,200 |
These are arithmetic translations of the median ratio.
They are not recommended quotas.
How Many Likes Should 10,000 Views Get?
At the study median:
approximately:
292 likes.
At:
5%
that would be:
500 likes.
At:
2%
200 likes.
Do not judge the video purely from this number.
How Many Likes Should 100,000 Views Get?
At:
2.92%
approximately:
2,920 likes.
But among videos with 100K-1M views, the actual subgroup median was lower:
2.49%.
That corresponds to:
2,490 likes per 100,000 views.
This demonstrates why view-scale-specific benchmarks are better.
How Many Likes Should 1 Million Views Get?
Among the million-view cohort:
median ratio:
2.17%.
At exactly:
1,000,000 views
that corresponds to:
21,700 likes.
The 25th-to-75th-percentile range would roughly translate to:
14,400 to 30,800 likes per million views.
Again:
these are descriptive cohort benchmarks.
Not requirements.
Does a High Like Rate Mean a Video Will Go Viral?
No.
Our data provides no evidence for that simple rule.
In fact:
Below-baseline videos
Median like rate:
3.28%.
5x+ outliers
2.41%.
That is nearly the reverse of what a simplistic engagement theory would predict.
High like rate can coexist with virality.
But high like rate by itself is not proof that virality will happen.
Can a Low Like Rate Video Go Viral?
Absolutely.
Our:
317 videos
in the 5x+ relative-performance group had a median like rate of only:
2.41%.
Some had lower.
A video can achieve massive distribution without maintaining a top-quartile engagement ratio.
Should You Delete a Video With a Low Like Ratio?
No.
Like ratio alone is nowhere near sufficient reason.
Before making any decision, inspect:
- Views
- CTR
- Retention
- Traffic sources
- Watch time
- Conversion
- Comments
- Audience response
- Search performance
- Long-term growth
A low like rate does not automatically mean the video is harming your channel.
Should You Change the Title or Thumbnail Because Like Rate Is Low?
Usually not based on like rate alone.
Titles and thumbnails primarily affect:
whether people choose to watch.
A low post-view engagement rate could reflect something inside the video rather than the packaging.
If impressions are high but clicks are low:
packaging deserves attention.
If CTR is healthy but retention collapses:
content delivery may be the problem.
Do not solve the wrong stage of the funnel.
Use the Right Metric for the Right Question
| Question | Better metric |
|---|---|
| Are people clicking? | CTR |
| Are people watching? | Retention / watch time |
| Is the video reaching further than normal? | Relative views |
| Are viewers visibly engaging? | Like/comment ratios |
| Are subscribers converting? | Subscriber gain analytics |
| Is the topic a breakout? | Channel-relative outlier multiple |
No single metric can replace the others.
How to Benchmark a Competitor's Like Rate
For public competitor research:
Step 1: Collect at least 10-20 comparable videos
More is better.
Step 2: Calculate each video's like rate
Likes ÷ views × 100
Step 3: Use the median
Do not let one extraordinary video dominate your baseline.
Step 4: Compare similar view scales
A 10K-view video should not automatically be benchmarked against a 10M-view video.
Step 5: Identify unusual combinations
The most interesting videos may be:
- High views + high like rate
- Low views + extremely high like rate
- Huge outlier + unexpectedly low rate
- Strong engagement + weak reach
Those patterns generate better questions.
How OverseerOS Helps
Use the free OverseerOS YouTube Channel Analyzer to inspect a public channel's:
- Recent videos
- Top videos
- Public view counts
- Titles
- Thumbnails
- Video durations
- Publishing patterns
Then calculate engagement in context.
Do not simply ask:
Which video has the most likes?
Ask:
Which video performed unusually well relative to this channel, and did its engagement density also change?
A useful workflow is:
Establish channel baseline
→
Find relative outliers
→
Compare like-to-view ratios
→
Control for video size and age
→
Inspect title and thumbnail
→
Identify repeatable audience patterns
That is far more useful than chasing a universal:
5% target.
How This Relates to Views-to-Subscriber Ratio
Like-to-view ratio asks:
How much visible positive engagement occurs per view?
Views-to-subscriber ratio asks:
How large is a video's reach relative to the channel's subscriber count?
They measure completely different things.
A small channel can have:
- 500% views/subscriber ratio
- 2% like rate
or:
- 30% views/subscriber ratio
- 8% like rate
One measures:
reach relative to channel size.
The other:
likes relative to views.
Use both only when the question requires both.
How This Relates to First-24-Hour Performance
A new upload should primarily be compared with:
other videos at the same age.
Our first-24-hour YouTube views study focuses on fixed-age reach.
For likes, our smaller exploratory 24-hour sample showed a:
1.54% median.
That does not invalidate the mature:
2.92%
benchmark.
They describe different lifecycle stages and samples.
A Simple Like-Rate Dashboard
For every upload, track:
| Metric | Video |
|---|---|
| 24h views | |
| 24h likes | |
| 24h like rate | |
| 7d views | |
| 7d likes | |
| 7d like rate | |
| Mature views | |
| Mature likes | |
| Mature like rate | |
| Relative view multiple |
This prevents you from judging one moving metric in isolation.
The Three Benchmarks You Actually Need
1. Your historical median like rate
Most important.
2. Comparable-size/video-age benchmark
Useful context.
3. Relative view performance
Essential for understanding whether engagement came with reach.
A video with:
6% likes
and:
0.4x normal views
tells a very different story from:
4% likes
and:
8x normal views.
How We Analyzed the Data
This study used public YouTube video and channel observations captured through OverseerOS research workflows.
The research was frozen on:
September 5, 2026.
The latest available public video observation at analysis time was approximately:
08:48 UTC.
Channel Qualification
A channel needed:
- At least 20 mature long-form videos
- Strong public-catalog coverage
- Captured video count approximately 80% to 120% of its latest reported public video count
This was designed to reduce the risk of analyzing a tiny fragment of a much larger channel.
Video Qualification
Videos needed:
- Duration greater than three minutes
- Age of at least 90 days
- Positive public view count
- Positive public like count
The final like-rate cohort contained:
3,292 mature long-form videos across 89 channels.
Why Were Zero-Like Videos Excluded?
The broader eligible mature cohort contained:
3,428 videos.
Of these:
- 3,292 had positive like counts
- 136 had a recorded like count of zero
A recorded zero can be ambiguous in public datasets.
It may represent:
- Truly zero likes
- Unavailable engagement data
- Hidden or inaccessible counts
- Collection limitations
Rather than assume every zero meant:
nobody liked this video
we excluded those rows from the primary ratio study.
That is a conservative choice.
Primary Like Rate Formula
For each qualifying video:
Like rate =
Latest public like count
÷
Latest public view count
Then we calculated:
- Percentiles
- Mean
- Threshold rates
- View-count buckets
- Channel-level medians
Channel-Level Sensitivity Check
Some channels contributed far more videos than others.
So we also calculated:
one median like rate per channel
and gave each of the:
89 channels
equal weight.
Result:
2.91%.
Almost identical to the video-level:
2.92%.
Recent-Video Sensitivity Check
We restricted the sample to mature videos approximately:
90 to 730 days old.
That produced:
2,335 videos across 84 channels.
Median:
3.03%.
Again, close to the full-study result.
View-Scale Analysis
Videos were grouped by latest public view count:
- Under 10K
- 10K-100K
- 100K-1M
- 1M+
The like-rate median declined steadily as view scale increased.
This was one of the study's strongest descriptive patterns.
Relative-Performance Analysis
For another sensitivity analysis, we calculated each video's public views relative to the median views of videos from:
- The same channel
- The same publication year
We required at least:
five videos
in a channel-year baseline.
Then videos were grouped into:
- Below 1x
- 1x-2x
- 2x-5x
- 5x+
This allowed us to ask:
Do the channel's strongest view outliers also have the strongest like rates?
They did not.
24-Hour Exploratory Analysis
Separately, we examined recent long-form videos with public snapshots between:
20 and 28 hours after publication.
For each video, we selected the snapshot closest to:
24 hours.
Final sample:
84 videos across 54 channels.
Median snapshot age:
24.62 hours.
Median like-to-view ratio:
1.54%.
This analysis is secondary because its sample is much smaller.
Limitations
Likes are public engagement, not total satisfaction
Not every satisfied viewer clicks Like.
Views are not unique viewers
The denominator represents public views, not necessarily unique people.
Like counts can be unavailable
We excluded 136 eligible mature videos with zero recorded likes rather than assuming those were genuine 0% engagement rates.
Videos were not measured at exactly the same mature age
All primary videos were at least 90 days old, but some were much older than others.
The recent 90-730-day sensitivity test produced a similar median, which helps, but does not eliminate lifecycle differences.
Topic and niche matter
Different audiences have different interaction behavior.
This study did not claim one universal like rate for every niche.
Calls to action differ
Some creators explicitly ask viewers to like.
Others rarely do.
Public like rate does not reveal CTR or retention
Those are private performance dimensions for competitor videos.
Correlation is not causation
The negative relationship between view scale and like ratio does not prove that gaining views causes lower engagement.
The cohort is selected
These were channels with substantial mature long-form catalogs and good public data coverage.
This is not a random census of every YouTube upload.
Long-form only
Videos had to be longer than three minutes.
Do not automatically apply these benchmarks to Shorts.
What the Data Actually Says
The strongest defensible conclusion is:
Across 3,292 mature long-form videos from 89 high-coverage public YouTube channels, the median public like-to-view ratio was 2.92%. The 25th percentile was 1.84%, the 75th percentile 4.36%, and the 90th percentile 6.40%. Like rate declined as view scale increased, from a 3.54% median below 10K views to 2.17% on million-view videos. Channel-relative 5x outliers also had a lower median like rate, 2.41%, than below-baseline videos at 3.28%.
That means:
A higher like ratio is not automatically a sign of a better-performing YouTube video.
Final Verdict
What is a good like-to-view ratio on YouTube?
For mature long-form videos in this OverseerOS study:
around 3% was typical.
Use these reference points:
1% or less
Low relative to this cohort.
2%
Below median but common.
3%
Approximately average.
4%+
Strong.
5%+
Top-fifth territory.
6.4%+
Top 10%.
10%+
Rare.
But the more important finding is:
Do not optimize for like rate in isolation.
Videos below:
10,000 views
had a median like rate of:
3.54%.
Videos above:
1 million
had:
2.17%.
And 5x channel-relative breakouts had:
2.41%.
So a video's ratio can fall while its:
- Total likes increase
- Total views explode
- Audience expands
- Channel-relative performance improves
The right diagnosis is:
Reach
+
Relative performance
+
Like rate
+
Video age
+
First-party CTR and retention
Not:
Like rate = quality
If your video has a 2% like rate but is getting:
10x your normal views,
do not panic because someone told you:
5% is the minimum.
If your video has a:
10% like rate
but reaches almost nobody:
do not assume the content strategy is working perfectly.
Use the ratio for what it is:
a measure of visible engagement density.
Then combine it with the metric that matters just as much:
How far did the video travel?
Analyze any public YouTube channel with OverseerOS, establish its normal view baseline, and compare engagement in context instead of judging videos from one universal percentage.
Frequently Asked Questions
What is a good like-to-view ratio on YouTube?
Around 3% was typical in the OverseerOS study of 3,292 mature long-form videos. The median was 2.92%.
What is the average YouTube like-to-view ratio?
The arithmetic mean in this study was 3.53%, while the more robust median was 2.92%.
Is a 1% like rate good on YouTube?
It was low relative to this cohort. More than 92% of qualifying videos exceeded 1%, but high-reach videos can still perform well with relatively low like rates.
Is a 2% like-to-view ratio good?
It is below the overall median but common. Million-view videos had a median of 2.17%.
Is a 3% like ratio good?
Yes. It was almost exactly the median of the mature long-form sample.
Is a 4% like rate good?
Yes. Only 29.6% of videos reached at least 4%.
Is a 5% like-to-view ratio good?
Yes. Only 18.7% of videos reached 5% or higher.
Is a 10% like rate good?
It is unusually high. Only 2.3% of mature videos in this study reached 10%+.
How many likes should 1,000 YouTube views get?
At the study median of 2.92%, about 29 likes per 1,000 views.
How many likes should 10,000 views get?
At 2.92%, approximately 292 likes. This is a descriptive benchmark, not a target.
How many likes should 100,000 YouTube views get?
At the overall median, about 2,920. The 100K-1M view subgroup had a lower median rate of 2.49%, equivalent to about 2,490 likes per 100,000 views.
How many likes should a million-view video have?
The 1M+ cohort had a median like rate of 2.17%, equivalent to roughly 21,700 likes per million views.
What is a good like ratio for a viral YouTube video?
The 5x+ channel-relative breakout group had a median like rate of 2.41%.
Do viral videos have higher like rates?
Not in this study. 5x+ outliers had a lower median like rate than below-baseline videos.
Does a high like-to-view ratio make a video go viral?
This study does not support that conclusion. Higher view scale was actually associated with lower like-to-view ratios.
Can a video go viral with a 2% like rate?
Yes. Many high-view videos had ratios around this level, and the million-view median was 2.17%.
Why does like rate decrease when views increase?
One possible explanation is that broader distribution reaches less-engaged audiences and expands views faster than likes. This study cannot establish the causal mechanism.
Is a lower like ratio bad when a video starts blowing up?
Not necessarily. A ratio can decline while total views and total likes increase dramatically.
Is like rate the same as engagement rate?
It is one engagement ratio, specifically likes divided by views. It does not include comments, shares, watch time, or other engagement signals.
Is like rate the same as CTR?
No. CTR measures clicks relative to impressions. Like rate measures likes relative to views.
Does like rate show audience retention?
No. Retention and like behavior are separate metrics.
Does YouTube reward videos with lots of likes?
This public-data study cannot isolate YouTube's internal weighting of likes. It should not be used to claim that a specific like-rate threshold triggers distribution.
What is a good like rate in the first 24 hours?
In a separate exploratory sample of 84 recent long-form uploads, the median at roughly 24 hours was 1.54%, with a 25th-75th percentile range of 1.04% to 2.49%.
Why is the first-day like rate lower than the mature benchmark?
The analyses use different lifecycle stages and cohorts. Like and view accumulation can change over time, so same-age comparisons are preferable.
Should I compare my new video's like rate with old videos?
Only carefully. Compare videos at similar ages whenever possible.
What was the top-quartile YouTube like rate?
4.36% or higher in the mature cohort.
What was the top-10% like rate?
6.40% or higher.
How common is a 5% YouTube like ratio?
18.7% of qualifying videos reached at least 5%.
How common is a 10% ratio?
2.3%.
Do smaller videos have higher like rates?
They did in this sample. Videos under 10K views had a 3.54% median versus 2.17% among million-view videos.
What like rate did videos with 10K-100K views get?
Median: 3.38%.
What like rate did videos with 100K-1M views get?
Median: 2.49%.
What like rate did million-view videos get?
Median: 2.17%.
Should I delete a YouTube video with a low like ratio?
No. Like ratio alone is not enough information to make that decision.
Should I change my thumbnail if the like rate is low?
Not solely because of the like rate. Thumbnail changes are better diagnosed with impressions, CTR, and packaging performance.
Is total likes or like rate more important?
They answer different questions. Total likes measures scale of visible engagement. Like rate measures engagement density.
Should I use average or median like rate?
Median is usually better for benchmarking because unusually high ratios can distort the average.
How do I calculate YouTube like-to-view ratio?
Divide likes by views and multiply by 100.
Can OverseerOS help analyze YouTube engagement?
OverseerOS Channel Analysis lets you inspect public video performance, top videos, recent uploads, titles, thumbnails, views, and channel patterns so engagement can be evaluated alongside relative reach rather than in isolation.