How many views should a YouTube video get in its first 24 hours?
There is no universal number.
A first-day result that is exceptional for one channel can be a failure for another.
OverseerOS tracked 179 public YouTube uploads across 57 channels and captured each video as close as possible to its first 24 hours after publishing.
To keep the measurement tight, every qualifying snapshot had to occur between:
20 and 28 hours after publication.
The median observation point was:
- 24.82 hours for long-form videos
- 24.03 hours for the duration-based short-form cohort
The raw numbers were enormous and extremely uneven.
Among 37 long-form videos across 29 channels:
- 25th percentile: 32,452 views
- Median: 61,982 views
- 75th percentile: 210,956 views
- 90th percentile: 989,349 views
Among 142 duration-based short-form videos across 33 channels:
- 25th percentile: 126,576 views
- Median: 499,193 views
- 75th percentile: 2,285,429 views
- 90th percentile: 4,153,051 views
But these numbers are not universal YouTube benchmarks.
The channels in the OverseerOS research corpus are a selected public research cohort, not a random sample of every creator on YouTube.
And the distributions themselves reveal why a universal number would be misleading.
The middle 50% of long-form first-day results spanned:
6.5x.
For the short-form cohort:
18.1x.
So the answer to:
How many views should my YouTube video get in 24 hours?
is not:
1,000.
It is not:
10% of your subscribers.
And it is not:
100,000.
The better answer is:
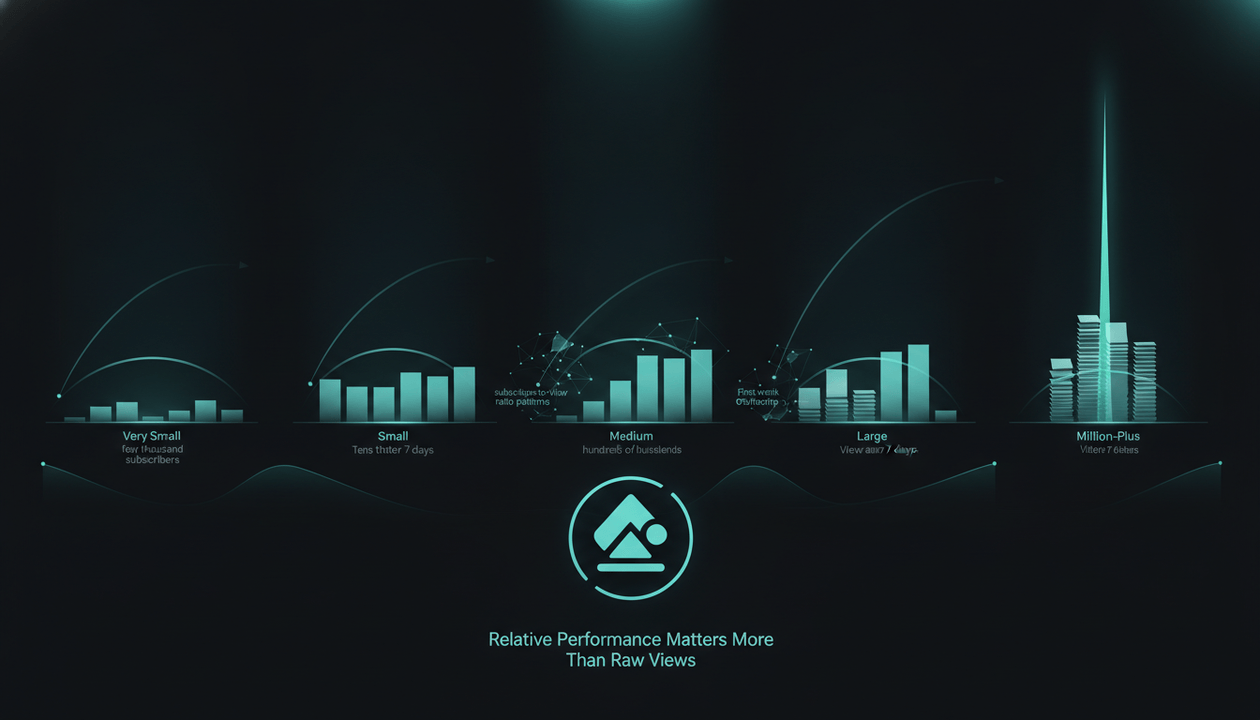
A good first 24 hours means the video is performing strongly relative to the first-24-hour results of your own recent, comparable videos.
Your channel is the benchmark.
Not the platform.
Key Findings
| Finding | OverseerOS result |
|---|---|
| Public uploads tracked around first 24 hours | 179 |
| Unique channels represented | 57 |
| Snapshot window | 20–28 hours after publication |
| Long-form videos | 37 across 29 channels |
| Short-form duration proxy | 142 across 33 channels |
| Median long-form observation age | 24.82 hours |
| Median short-form observation age | 24.03 hours |
| Long-form 25th percentile | 32,452 views |
| Long-form median | 61,982 views |
| Long-form 75th percentile | 210,956 views |
| Long-form 90th percentile | 989,349 views |
| Long-form middle-50% spread | 6.5x |
| Short-form 25th percentile | 126,576 views |
| Short-form median | 499,193 views |
| Short-form 75th percentile | 2,285,429 views |
| Short-form 90th percentile | 4,153,051 views |
| Short-form middle-50% spread | 18.1x |
| Equal-channel short-form median | 214,608 views |
| Equal-channel long-form median | 61,982 views |
The strongest finding is not one particular view benchmark.
It is this:
Even inside the same broad format, first-day YouTube performance occupied an enormous range.
That is why a global "good first 24 hours" number is usually the wrong benchmark.
The Direct Answer: What Is a Good Number of YouTube Views in 24 Hours?
A good first-day view count is one that meaningfully outperforms your own normal first-day baseline for comparable videos.
Use:
First-24-hour performance index =
New video's first-24-hour views
÷
Median first-24-hour views of comparable recent uploads
Suppose your last 10 comparable long-form videos received these first-day results:
8,200
11,500
9,800
13,100
10,400
8,900
12,600
9,300
10,900
15,000
Your approximate median is:
10,650 views.
Now suppose your new video gets:
18,000 views in its first 24 hours.
Calculation:
18,000 ÷ 10,650 = 1.69x
That is a strong first-day result for your channel.
Another creator might receive:
100,000 views
and still be underperforming if their normal first-day result is:
200,000.
Absolute views measure reach.
Relative performance tells you whether the video is unusually strong for the channel.
Finding 1: Long-Form First-Day Views Varied by More Than 6x Across the Middle 50%
Among the 37 qualifying long-form videos:
10th percentile
15,827 views
25th percentile
32,452 views
Median
61,982 views
75th percentile
210,956 views
90th percentile
989,349 views
Even if we ignore the weakest 25% and strongest 25%, the remaining middle half stretched from:
32,452
to:
210,956 views.
That is a:
6.5x range.
And the gap between the median and 90th percentile was nearly:
16x.
This immediately destroys the idea that there should be one universal first-day benchmark.
Even within this selected long-form cohort, there was no narrow number around which successful videos clustered.
Performance was highly skewed.
Why a Global 24-Hour Benchmark Fails
Imagine someone tells you:
A good YouTube video should get 50,000 views in its first day.
Now consider three channels.
Channel A
Normal first-day views:
2,000
New video:
20,000
Relative performance:
10x
That is a major breakout.
Channel B
Normal:
50,000
New video:
50,000
Relative performance:
1x
Normal.
Channel C
Normal:
500,000
New video:
50,000
Relative performance:
0.1x
Potentially a serious underperformance.
Same:
50,000 views.
Three completely different conclusions.
This is why the correct denominator matters more than the headline number.
Finding 2: Shorts and Long-Form Should Never Share One First-Day Benchmark
The pooled median in the duration-based short-form cohort was:
499,193 views.
For long-form:
61,982.
That is an approximately:
8.05x difference.
It would be tempting to conclude:
Short videos get eight times more first-day views.
That is not a defensible conclusion from this study.
The groups contain different:
- Channels
- Audience sizes
- Content systems
- Publishing behaviors
- View distributions
- Recommendation environments
And the OverseerOS research layer's short-form label is a duration-based proxy, not YouTube's private official Shorts classification.
The useful conclusion is much narrower:
Combining Shorts and long-form into one first-24-hour benchmark can produce a meaningless comparison.
Analyze them separately.
If your channel publishes:
- Shorts
- 15-minute videos
- Podcast clips
- Full podcast episodes
- Livestreams
you may need several different baselines.
"Same channel" does not automatically mean:
"Comparable video."
Finding 3: The Short-Form Distribution Was Even More Extreme
The duration-based short-form cohort contained:
142 videos across 33 channels.
Its distribution around the first day looked like this:
| Percentile | Public views |
|---|---|
| 10th | 39,933 |
| 25th | 126,576 |
| Median | 499,193 |
| 75th | 2,285,429 |
| 90th | 4,153,051 |
| 95th | 4,804,581 |
The middle 50% alone ranged from:
126,576
to:
2,285,429.
That is an:
18.1x spread.
The smallest qualifying observation had:
5,801 views.
The largest:
10,344,501.
One universal first-day number cannot describe a distribution this wide.
Finding 4: Pooled Benchmarks Can Be Distorted by Prolific Channels
There is another statistical problem.
Some channels contributed more qualifying videos than others.
If one highly successful short-form channel publishes several videos during the research window, a simple pooled median can give that channel more influence.
So we ran a channel-level sanity check.
For each channel, we first calculated its own median first-day result.
Then we gave every channel one equal vote.
Long-form
Equal-channel median:
61,982 views
The same as the pooled video median because most channels contributed very few qualifying videos.
Short-form duration proxy
Pooled video median:
499,193 views
Equal-channel median:
214,608 views
That is a major difference.
The takeaway is important:
A platform benchmark can change simply because certain channels upload more often.
If you are benchmarking your own channel, this problem disappears.
Your real question is:
How does this video compare with my comparable uploads?
That is a much cleaner comparison.
Finding 5: Subscriber Count Alone Did Not Produce a Clean Benchmark
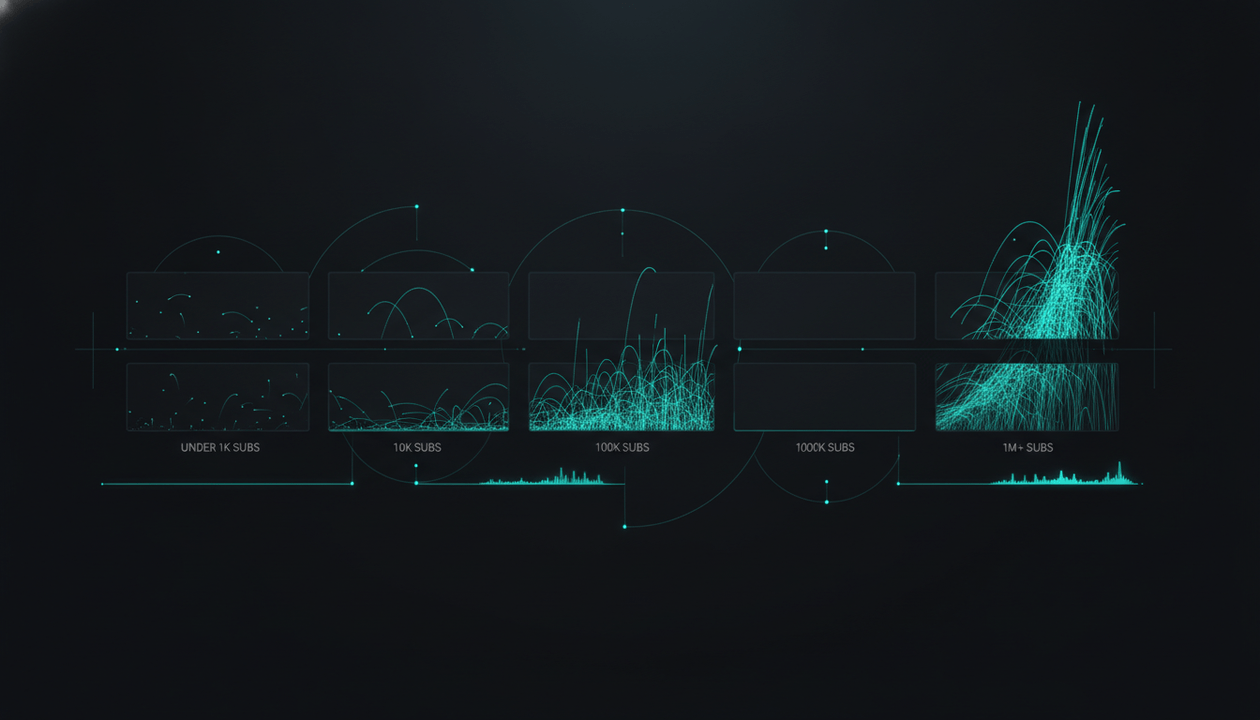
We also explored long-form first-day views by current subscriber band.
The groups were small, so these numbers should be treated as descriptive rather than universal benchmarks.
| Current subscriber band | Videos | Channels | 25th percentile | Median | 75th percentile |
|---|---|---|---|---|---|
| Under 100K | 8 | 7 | 26,415 | 34,940 | 59,732 |
| 100K–1M | 15 | 11 | 31,113 | 49,170 | 127,821 |
| 1M+ | 14 | 11 | 84,280 | 227,920 | 1,013,353 |
Larger channels generally showed higher absolute first-day views.
That is unsurprising.
But look at the overlap.
The median under-100K video:
34,940 views.
The median 100K–1M video:
49,170.
Those distributions overlap substantially.
And the small sample means we should absolutely not turn this into:
A channel under 100K subscribers should get 35K views in 24 hours.
That would be a misuse of the data.
The channels in this research corpus are not a random representation of every small creator.
The useful lesson is:
Subscriber count provides context, but it is not enough to tell you what your own video should achieve.
Your recent video performance is a stronger operational benchmark.
Subscriber Count Is Not Your Active Audience
This distinction matters.
Suppose you have:
100,000 subscribers.
That does not mean:
100,000 people are waiting for every upload.
Some subscribers may:
- No longer use YouTube regularly
- Have changed interests
- Have subscribed years ago
- Only watch one format
- Have subscribed because of one viral topic
- Ignore most current uploads
Meanwhile, a channel with:
10,000 subscribers
can publish a video that reaches:
100,000 people
in one day.
Subscribers measure subscriptions.
They do not define the maximum size of the audience YouTube can potentially find for a video.
Finding 6: First-Day Views Were Small Relative to Mature Historical Views on Many Channels
We ran one additional context check.
For a smaller subset, we required each channel to have at least:
10 older mature long-form videos
available for comparison.
That produced:
23 first-day videos across 19 channels.
The median historical comparison set contained:
40 mature videos.
We then compared:
First-day views on the new upload
÷
Median current views of older mature videos
The resulting distribution was:
| Percentile | First-day views as share of mature historical median |
|---|---|
| 10th | 0.5% |
| 25th | 5.5% |
| Median | 14.9% |
| 75th | 29.1% |
| 90th | 50.3% |
This is not an eventual-view forecast.
The historical videos were much older and had far more time to accumulate views.
But it provides useful context.
In this small subcohort, the median new long-form upload had accumulated about:
15% of the older mature-video median
around its first day.
A first-day video already reaching approximately half of the channel's mature historical median sat near the upper end of this particular comparison.
Again:
Do not use 15% as a universal rule.
Use it as evidence that lifecycle stage matters.
A one-day-old video should not be judged like a one-year-old video.
The Biggest First-24-Hour Mistake: Comparing Against Lifetime Views
Imagine your previous winner has:
500,000 views.
It is:
nine months old.
Your new video has:
35,000 views after one day.
You think:
The new video is doing 93% worse.
That comparison is almost useless.
The older video had:
hundreds of additional days
to accumulate views.
Instead compare:
Previous video's views after 24 hours
vs
New video's views after 24 hours
Same age.
Same format.
Ideally similar channel era.
That is the benchmark you want.
How to Build Your Own First-24-Hour YouTube Benchmark
This is more useful than any platform-wide table.
Step 1: Choose the same format
Do not mix:
- Shorts
- Long-form
- Livestreams
- Podcast clips
- Full episodes
If the viewer experience is materially different, build a different baseline.
Step 2: Choose recent videos
Start with your last:
10 comparable uploads.
Use:
20
if your format and channel strategy have remained stable long enough.
Our YouTube channel analysis sample-size study found that very small samples can produce unstable channel-performance estimates.
Step 3: Record each video's first-24-hour views
Your table could look like this:
| Video | First 24-hour views |
|---|---|
| 1 | 14,200 |
| 2 | 9,800 |
| 3 | 12,400 |
| 4 | 18,100 |
| 5 | 11,500 |
| 6 | 10,700 |
| 7 | 35,000 |
| 8 | 13,200 |
| 9 | 9,900 |
| 10 | 15,400 |
Step 4: Use the median
The giant:
35,000-view
result should not automatically redefine what is normal.
Calculate the median.
Suppose it is:
12,800.
That becomes your first-day baseline.
Step 5: Calculate the new video's index
New upload:
20,000 views.
20,000 ÷ 12,800
=
1.56x
Now you have context.
Instead of:
Is 20K good?
you know:
This video is performing at 1.56x my recent first-day baseline.
That is actionable.
A Practical First-24-Hour Performance Scale
The following is a diagnostic framework, not an official YouTube classification.
| First-day performance vs your baseline | Interpretation |
|---|---|
| Under 0.5x | Materially below normal |
| 0.5x–0.8x | Below normal |
| 0.8x–1.2x | Around baseline |
| 1.2x–2x | Strong first-day result |
| 2x–5x | Major outlier |
| 5x+ | Exceptional relative breakout |
The purpose is not to turn every number into a verdict.
It is to identify which videos deserve investigation.
Example: Is 1,000 Views in 24 Hours Good?
It depends.
Channel A
Typical first day:
200 views
New video:
1,000.
1,000 ÷ 200 = 5x
Exceptional relative result.
Channel B
Typical:
900
New video:
1,000
1.11x
Normal-to-good.
Channel C
Typical:
5,000
New video:
1,000
0.2x
Major underperformance.
So:
Is 1,000 views good in the first day?
has no useful answer without channel context.
Is 10,000 Views in 24 Hours Good?
Same principle.
If your normal first day is:
1,500
then:
10K ÷ 1.5K = 6.67x
Major breakout.
If your normal result is:
12,000
then:
10,000
is slightly below baseline.
Absolute numbers only become meaningful once you know what they are being compared with.
Is 100,000 Views in 24 Hours Good?
For many creators:
absolutely.
But not universally.
A channel that routinely receives:
500,000 first-day views
would interpret 100K very differently from a channel that normally gets:
10,000.
The higher the existing baseline, the larger the absolute view number required to create the same relative breakout.
This is the same reason our study of whether small YouTube channels can go viral found that smaller channels can produce enormous relative outliers without reaching the absolute view totals of giant creators.
Do Not Use Subscribers as a Fixed First-Day Percentage
You may hear rules such as:
Your first-day views should equal 10% of your subscribers.
or:
20% is good.
or:
If views exceed subscribers, you are viral.
These can occasionally describe a specific channel.
They are weak universal benchmarks.
Consider:
Search-heavy channel
A large percentage of views may come from people who never subscribed.
Browse-heavy entertainment channel
One breakout may reach several times the subscriber count quickly.
Old channel
Subscriber count may significantly overstate the currently active audience.
New breakout channel
Current subscribers may have been acquired by the very type of videos you are trying to benchmark.
The stronger comparison is:
New first-day result
vs
Historical first-day result
for comparable content.
What Should You Check Besides Views After 24 Hours?
Views tell you the public outcome.
They do not fully explain it.
For your own channel, diagnose the underlying funnel.
Impressions
Did YouTube show the video to enough people?
Click-through behavior
Did the packaging earn interest when the video was presented?
Early retention
Did the opening deliver what the title and thumbnail promised?
Average view duration
Did the content sustain attention?
Traffic sources
Did performance come from:
- Browse
- Suggested
- Search
- External traffic
- Notifications
Returning viewers
Did the existing audience show up?
New viewers
Did the video expand beyond the usual audience?
A first-day view count tells you:
what happened.
Your private analytics help explain:
where the problem or opportunity may be.
A First-Day Diagnostic Matrix
| First-day result | What it may mean | What to investigate |
|---|---|---|
| Views high, retention strong | Strong launch | Identify repeatable topic and packaging mechanisms |
| Views high, retention weak | Packaging may have outrun satisfaction | Check expectation match |
| Views low, impressions low | Limited early distribution or topic demand | Topic, audience fit, traffic sources |
| Views low, impressions high | Packaging problem possible | Title and thumbnail |
| CTR strong, views still limited | Topic ceiling or limited impressions | Audience size, distribution, competition |
| One video low after a breakout | Possible return to baseline | Compare with 10-video median |
| Several comparable videos low | Possible real decline | Rolling baseline and private analytics |
This is a diagnostic framework.
It does not establish algorithmic causality from one metric.
Do the First 24 Hours Determine Whether a YouTube Video Will Succeed?
This study cannot prove that.
And that is important.
We measured videos around their first day.
We have not yet followed this exact recent cohort long enough to establish a mature lifetime outcome for every upload.
So we cannot honestly claim:
X% of lifetime views always happen in 24 hours.
Or:
A bad first day permanently kills a video.
Or:
A video above a specific first-day threshold is guaranteed to go viral.
Those would require a different longitudinal study.
The first 24 hours are useful because they give creators an early, standardized comparison point.
They are not a crystal ball.
Can a YouTube Video Recover After a Bad First 24 Hours?
Yes, a poor first-day result does not logically make later growth impossible.
But whether your video is likely to recover depends on why the early result was weak.
For example:
Search-driven video
Demand can accumulate over a longer period.
Evergreen topic
The video may have a much longer discovery window.
Timely browse-driven idea
A weak launch may be harder to overcome if demand disappears quickly.
Packaging problem
A stronger title or thumbnail may materially change how viewers respond.
Topic problem
Better packaging cannot create unlimited demand for an idea people do not care about.
Do not diagnose a recovery strategy from views alone.
Find the bottleneck first.
Why Comparing With Your Previous Video Is Dangerous
Our separate research into inconsistent YouTube views found enormous video-to-video variability across mature long-form channels.
Suppose:
Previous video's first day:
100,000.
Current video:
25,000.
You think:
Views are down 75%.
But your normal first-day median may be:
20,000.
Then:
Current video =
1.25x normal
The current upload is fine.
The previous one was exceptional.
This is perhaps the most important psychological adjustment a creator can make.
Do not let your last breakout become your new definition of normal.
The Better YouTube Performance Dashboard
Track four numbers.
1. First-day median
Your normal launch performance.
Example:
15,000 views.
2. Current first-day index
Example:
24K ÷ 15K = 1.6x
3. Rolling mature median
What your comparable videos eventually tend to accumulate.
4. Outlier rate
How frequently videos reach:
- 2x
- 3x
- 5x
- 10x
Now you can distinguish:
baseline growth
from:
breakout frequency.
Those are different goals.
Raising the Baseline Is More Important Than Chasing One First-Day Record
Imagine Channel A:
First-day baseline: 5K
Occasional breakout: 100K
Channel B:
First-day baseline: 40K
Occasional breakout: 120K
Channel A has the more spectacular multiplier.
Channel B has the stronger normal business.
The goal is not only:
Get the biggest first day possible.
It is:
Raise what normal looks like while continuing to create upside.
That means studying both:
- Why winners escaped
- Why normal videos perform as they do
How to Apply This With OverseerOS
Start with the free OverseerOS YouTube Channel Analyzer.
Analyze your own public channel or a relevant competitor.
Use the report to understand:
- Top videos
- Recent uploads
- Public view distribution
- Titles
- Thumbnails
- Video duration
- Publishing patterns
Then separate:
Baseline videos
What normally happens?
Recent videos
What is working now?
Outliers
Which videos dramatically escaped normal performance?
The public analyzer cannot see a competitor's private first-24-hour YouTube Analytics.
But it can establish the broader channel context that a raw view count needs before it becomes strategically useful.
For your own channel, combine that public research with your private fixed-age analytics.
The workflow becomes:
Establish comparable format
→
Build first-day baseline
→
Score current upload
→
Diagnose impressions / packaging / retention
→
Study unusual winners
→
Create the next original experiment
That is much stronger than checking one number at midnight and asking:
Is this good?
The First-24-Hour YouTube Audit
Use this after every important upload.
Before publishing
- I know the median first-day performance of my last 10 comparable videos.
- Shorts and long-form have separate baselines.
- I know the current topic's expected audience.
- I have compared multiple title options.
- I have evaluated the thumbnail independently of the script.
- I know what result would count as normal, strong, or exceptional.
At 24 hours
- Record views.
- Compare them with the first-day median.
- Calculate the relative performance index.
- Record impressions.
- Review click behavior.
- Review early retention.
- Review traffic sources.
- Compare with videos at the same age.
If the video is below baseline
- Do not panic from the view count alone.
- Check whether impressions are down.
- Check whether packaging is underperforming.
- Check whether retention confirms the promise.
- Check whether the topic serves the normal audience.
- Compare against several videos, not one recent winner.
If the video is far above baseline
- Calculate the multiplier.
- Identify what changed.
- Study the topic.
- Study the title promise.
- Study the thumbnail concept.
- Look for similar winners on other channels.
- Separate repeatable mechanisms from one-time timing.
- Build an original follow-up rather than copying the winner.
How We Analyzed the Data
This study used public YouTube information captured through OverseerOS research and channel-analysis workflows.
The dataset was frozen on:
September 2, 2026.
The qualifying videos were published between:
August 24 and September 1, 2026.
The latest qualifying observation was collected on:
September 2, 2026.
The 24-hour window
Public snapshots do not necessarily arrive at exactly:
24:00:00
after every upload.
We therefore required each qualifying video to have a snapshot between:
20 and 28 hours after publication.
Where multiple snapshots qualified, we selected the one closest to:
24 hours.
The median observation age was:
- 24.82 hours for long-form
- 24.03 hours for the duration-based short-form cohort
This means the study should be interpreted as:
performance around the first 24 hours
rather than a perfectly synchronized platform-wide 24:00:00 measurement.
Format definition
Long-form videos were:
more than 180 seconds.
The short-form cohort contained videos:
180 seconds or shorter.
This is a duration-based research proxy.
It should not be interpreted as a guaranteed match for YouTube's private official Shorts classification for every video.
Final sample
179 videos
across:
57 public channels.
Breakdown:
- 37 long-form videos across 29 channels
- 142 duration-based short-form videos across 33 channels
Some channels appeared in both groups.
What We Measured
For each format, we calculated:
- 10th percentile views
- 25th percentile views
- Median views
- 75th percentile views
- 90th percentile views
- 95th percentile views
- Observation age
We also ran channel-level weighting checks so prolific publishers would not silently dominate the interpretation.
What We Did Not Use
We did not use identifiable customer data or private competitor analytics.
The study does not contain competitor:
- Impressions
- CTR
- Retention
- Watch time
- Traffic-source breakdown
- Revenue
- Returning-viewer data
Those are private to the channel owner.
Limitations
This study is intentionally descriptive.
The sample is not random
The channels entered the OverseerOS research corpus through public research, analysis, and discovery workflows.
The absolute view percentiles should not be interpreted as averages for all YouTube uploads.
The long-form sample is relatively small
The primary long-form cohort contained:
37 videos across 29 channels.
That is enough to publish useful descriptive information.
It is not enough to claim a universal platform benchmark.
Short-form representation is concentrated
The short-form cohort contained more videos per channel, which is why we included an equal-channel sensitivity check.
The snapshot window is not exactly 24 hours
Qualifying observations ranged from:
20 to 28 hours.
We chose the snapshot closest to 24 hours for each video.
Formats should not be compared causally
Higher raw short-form views do not prove that short-form content inherently performs better.
The groups contain different channels and distribution environments.
Current subscriber count is an imperfect benchmark
Subscriber totals do not directly measure active audience size.
The subscriber-band analysis is descriptive and contains small groups.
We cannot establish final-video success yet
The tracked cohort is recent.
This article does not claim that a specific first-day result predicts a specific lifetime result.
Public views cannot explain why performance changed
Only the channel owner can connect the public outcome with private analytics such as impressions, retention, traffic sources, and returning viewers.
Final Verdict
How many views should a YouTube video get in its first 24 hours?
There is no universal number.
Across the 179 public uploads OverseerOS tracked around their first day, the performance range was enormous.
For long-form:
- 25th percentile: 32,452
- Median: 61,982
- 75th percentile: 210,956
- 90th percentile: 989,349
For the duration-based short-form cohort:
- 25th percentile: 126,576
- Median: 499,193
- 75th percentile: 2,285,429
- 90th percentile: 4,153,051
Those are real results from this selected research sample.
They are not targets your channel should copy.
The middle 50% of long-form videos alone covered a:
6.5x range.
The short-form cohort covered:
18.1x.
And even the short-form pooled benchmark shifted dramatically once every channel received equal weight.
The lesson is clear:
A good first 24 hours is not a fixed number of views. It is strong performance relative to the first-day baseline of your own recent, comparable content.
So stop asking:
Should I have 10,000 views by now?
Build the better benchmark:
My new video's first-day views
÷
My recent comparable-video first-day median
If the result is:
0.6x
investigate.
If it is:
1x
you are around normal.
If it is:
1.8x
pay attention.
If it is:
5x
study everything that changed.
Because the purpose of the first 24 hours is not to satisfy somebody else's magic number.
It is to tell you whether this video is behaving differently from what your channel normally does.
Analyze your channel with OverseerOS, establish what normal really looks like, and judge every new upload against evidence rather than a generic benchmark.
Frequently Asked Questions
How many views should a YouTube video get in 24 hours?
There is no universal target. Compare the video's first-24-hour views with the median first-day views of your own recent, comparable uploads.
What is a good number of YouTube views in the first 24 hours?
A strong result is one that meaningfully exceeds your normal first-day baseline. A video at 1.5x your normal result can be much stronger strategically than a larger absolute view count on a channel with a much higher baseline.
Is 100 views in 24 hours good on YouTube?
It can be for a brand-new channel that normally receives far fewer views. It would be weak for a channel accustomed to thousands of first-day views.
Is 1,000 views in 24 hours good?
It depends on your baseline. If your comparable videos normally receive 200 first-day views, 1,000 represents a 5x breakout. If they normally receive 5,000, it is significant underperformance.
Is 10,000 views in the first 24 hours good?
It can be excellent, normal, or weak depending on the channel. Compare 10,000 with the median first-day performance of your own comparable videos.
Is 100,000 views in 24 hours good?
For many channels, 100,000 first-day views would be exceptional. For a channel that routinely receives several hundred thousand first-day views, it may be below normal.
What percentage of subscribers should watch in the first 24 hours?
There is no universal percentage. Subscriber count does not equal active audience size, and videos can reach large numbers of non-subscribers.
Should first-day views be higher than my subscriber count?
Not necessarily. Some videos can dramatically exceed subscriber count while others perform well without doing so. Use your own historical first-day performance as the primary benchmark.
Do the first 24 hours matter on YouTube?
They provide a useful standardized checkpoint for comparing new uploads with older videos at the same age. This study does not establish that the first 24 hours determine the video's final lifetime result.
Can a YouTube video go viral after 24 hours?
A first-day result does not mathematically prevent later growth. Search demand, evergreen discovery, changing interest, packaging, and other factors can affect performance after the first day.
Can a YouTube video recover from a bad first day?
It can, depending on why the launch was weak. Diagnose impressions, packaging, retention, traffic sources, and topic demand before deciding what to change.
Should I change my thumbnail after 24 hours?
Do not change it solely because the raw view count looks low. First determine whether the packaging is actually the bottleneck by checking impressions, click behavior, retention, and your historical baseline.
Should I compare my first-day views with my biggest video?
Usually not. Your biggest video may be an extreme outlier. Compare with the median of several comparable uploads.
How many previous videos should I use for a first-day benchmark?
Start with at least 10 comparable uploads when possible. Use 20 if your channel has enough stable history and the format has remained consistent.
Should Shorts and long-form have the same first-day benchmark?
No. In this OverseerOS sample, their public first-day distributions were dramatically different. Build separate baselines for different content formats.
How many first-day views did long-form videos get in the OverseerOS study?
Among 37 qualifying long-form videos, the median was 61,982 views around the first day. The 25th percentile was 32,452 and the 75th percentile was 210,956. These describe the selected research cohort, not all YouTube channels.
How many first-day views did short-form videos get?
Among the 142-video duration-based short-form cohort, the median public view count around the first day was 499,193. Because the sample is selected and several prolific channels contributed multiple videos, this should not be treated as a universal Shorts benchmark.
Why are first-day YouTube view benchmarks so different?
Channel size, active audience, format, topic, packaging, traffic sources, publishing history, and audience demand can all differ. A single platform-wide view target ignores that context.
What is the best way to judge a YouTube video's first day?
Use:
First-day performance index =
Current video's first-24-hour views
÷
Median first-24-hour views of comparable recent uploads
Then investigate whether the difference came from topic demand, packaging, retention, or distribution.
What should I do if my video gets 2x my normal first-day views?
Treat it as a strong signal. Compare the topic, title, thumbnail, audience promise, timing, and format with your normal videos, then test whether the underlying mechanism can be repeated in an original way.
What should I do if a video gets 5x my normal first-day views?
A 5x result deserves immediate research. Determine what made the video unusually attractive, check whether similar demand appears on other channels, and build an original follow-up rather than simply duplicating the winning video.