Most creators check their retention graph, see the cliff, and move on. The problem is not that the data is hard to find. The problem is knowing what to do at each specific drop-off point. Viewers leave at predictable moments, and without a system for identifying and fixing those moments, you are guessing at solutions while your average view duration quietly drags down your distribution. These 9 YouTube audience retention techniques give you a concrete fix for each moment viewers leave, organized by where in the video the drop happens and why.
Why Average View Duration is Your Most Crucial Metric
Average view duration (AVD) is the single number that tells YouTube whether your video is worth recommending. It measures how long the average viewer watches before leaving, expressed either in raw time or as a percentage of total video length. A video that holds 60 percent of its audience through the full runtime sends a clear signal: this content delivers on its promise.
YouTube's recommendation engine weighs watch time heavily when deciding which videos to surface in suggested feeds and search results. A video with a high click-through rate but a low AVD will plateau quickly. The algorithm interprets early exits as a mismatch between what the thumbnail promised and what the video delivered. That mismatch costs you distribution.
For most content categories, a retention rate above 40 percent of total video length is considered solid, but the more useful benchmark is comparing your own videos against each other. A tutorial that holds 55 percent is performing differently than a vlog that holds 35 percent, and both numbers are meaningful in context. Track AVD per video type, not just per channel, so you can isolate what is actually working.
One practical move: sort your last 20 videos by average percentage viewed, not by views. The videos near the top of that list are your retention models. Study their structure, pacing, and intro style before you copy the format of your most-viewed video.
Spotting Viewer Drop-Off Points: A Data-Driven Approach
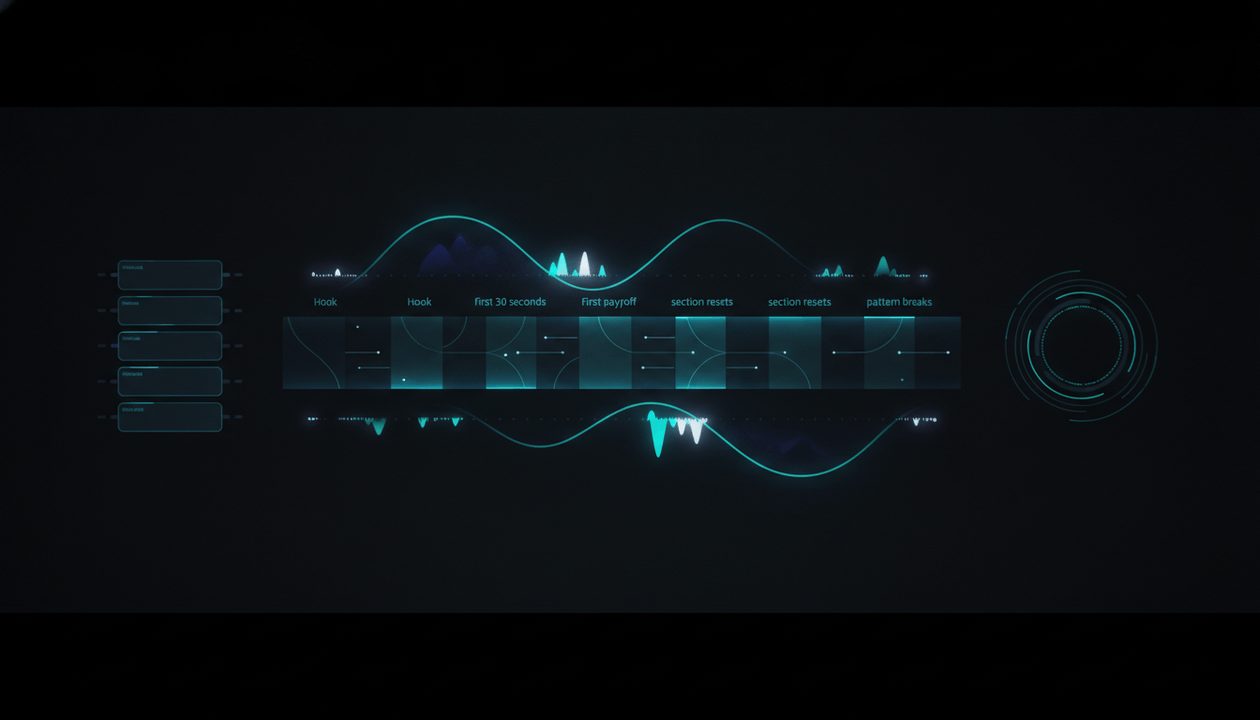
YouTube Studio's audience retention graph shows you a second-by-second curve for every video. Most creators glance at the overall shape. The sharper move is to look for three types of dips: the opening cliff, the mid-roll valley, and the end-of-content drop.
The opening cliff happens in the first 30 seconds and is almost always caused by one of two things: a slow intro that delays the payoff, or a mismatch between the thumbnail and the actual content. The mid-roll valley usually appears after a scene change, a sponsorship read, or a moment where the pacing slows. The end-of-content drop is natural and expected, but if it starts significantly before the video ends, you have dead time at the tail.
Pattern Breakdown: Diagnosing a Drop at the 90-Second Mark
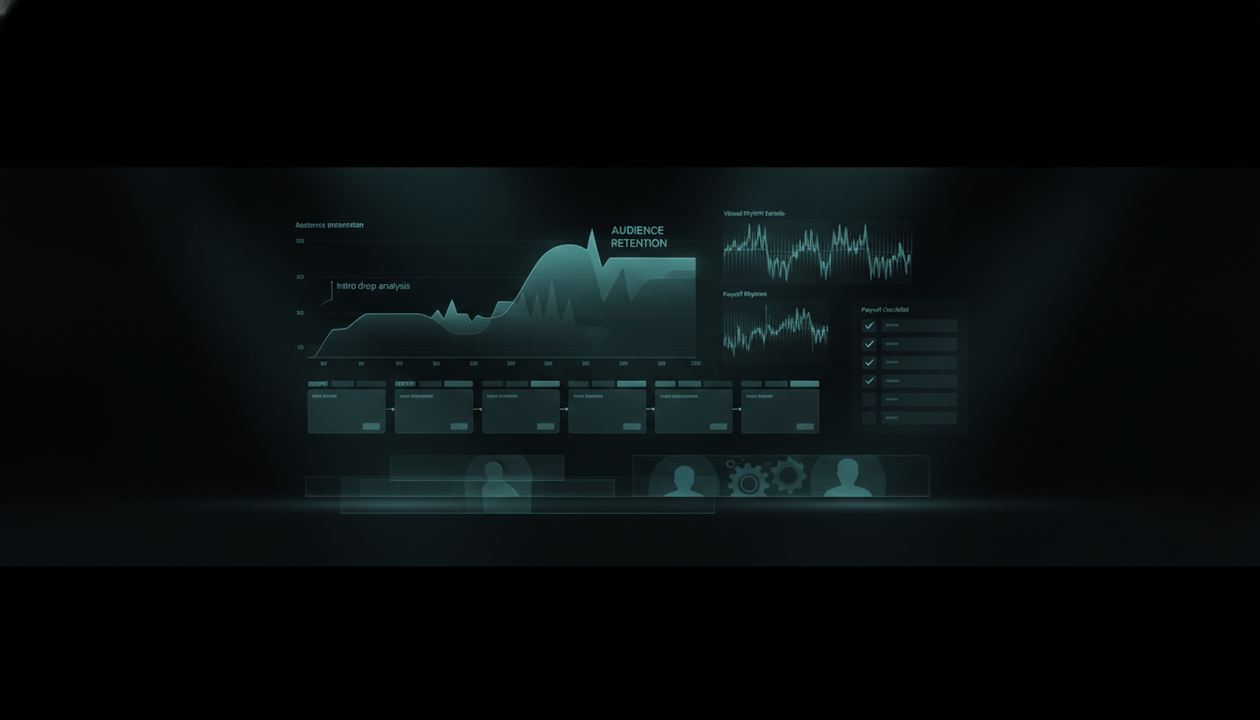
Consider a 12-minute explainer video where 35 percent of viewers leave between the 1:15 and 1:45 marks. The creator assumed viewers were bored with the topic. When they watched the segment back, they found a 45-second section of b-roll with no narration and no on-screen text. The fix was simple: add a text overlay and a brief voiceover line to bridge the visual gap. Retention at that timestamp improved noticeably on the next video using the same format.
The diagnostic process works like this. First, open the retention graph for a video with at least 500 views. Second, note every timestamp where the curve drops more than 5 percentage points in under 20 seconds. Third, scrub to that exact moment in the video and watch 30 seconds on either side. Fourth, ask: did the pacing slow, did the topic shift without a bridge, or did a visual element disappear? Fifth, write down the cause and the fix. Repeat for your next three videos and look for patterns across them.
This process turns a passive graph into an active editing checklist. Once you have identified your personal drop-off triggers, you can audit new videos before publishing by watching them with those triggers in mind.
Crafting Engaging Intros: Techniques That Hook Viewers
The first 30 seconds of a YouTube video carry disproportionate weight. Viewers decide almost immediately whether to continue, and that decision is emotional before it is rational. The strongest intros do three things fast: they confirm the viewer is in the right place, they create a small tension or open loop, and they signal that the payoff is coming soon.
Across high-performing videos in many different niches, one opening pattern shows up repeatedly: the creator states a specific, concrete outcome or scenario in the first sentence rather than introducing themselves or explaining what the video is about. Phrases that name a tangible result, a surprising contrast, or an immediate challenge tend to hold attention better than setup-heavy introductions. The viewer's brain responds to specificity and mild tension the same way it responds to an unresolved question: it wants the answer.
Psychologically, open loops are powerful retention tools. If you tell viewers at the start that you will reveal something specific at a certain point in the video, a portion of them will stay to collect that piece of information. This is not a trick. It is a content promise, and it only works if you actually deliver.
Copyable Intro Templates by Video Format
Use these as starting structures, not scripts. Adapt the language to your niche and voice.
Tutorial format:
State the problem in one sentence. Name the exact outcome the viewer will have by the end. Give a one-line preview of the method. Example shape: "If [specific problem], here is the exact [method] that fixed it for [audience type]. By the end of this video you will have [concrete result]."
Explainer or educational format:
Open with a surprising or counterintuitive statement related to the topic. Follow it with a one-sentence framing of why this matters to the viewer specifically. Example shape: "Most people assume [common belief]. Here is what actually happens, and why it changes [relevant outcome]."
Listicle or roundup format:
State the number and the stakes immediately. Tease the most surprising item on the list. Example shape: "There are [number] [things] that [outcome]. Number [X] is the one most people overlook entirely."
Vlog or documentary format:
Drop into action or conflict without preamble. Let the scene establish the stakes. Narration can frame the context, but the visual hook should come first.
9 Fixes for the Moments Viewers Drop Off
Each fix below targets a specific drop-off pattern. Match the fix to the problem you found in your retention graph, then use the checklist at the end of this section to audit your next video before publishing.
Fix 1: Cut the Pre-Intro Padding. Anything before the first meaningful moment is a tax on the viewer's patience. Remove logo animations, lengthy welcome-back openers, and subscribe reminders from the first 15 seconds. Get to the content immediately.
Fix 2: Rewrite Your First Sentence. If your first sentence is a greeting or a self-introduction, replace it with a concrete statement about what the viewer is about to learn or see. Specificity in the first sentence signals competence and relevance.
Fix 3: Add a Pattern Interrupt Every 90 to 120 Seconds. A pattern interrupt is any deliberate change in stimulus: a cut to a different angle, a graphic, a sound effect, a shift in narration pace, or an on-screen question. Viewers' attention naturally drifts in cycles. Interrupting the pattern resets their focus without requiring them to rewind.
Fix 4: Bridge Every Scene Change With a Forward Pull. When you transition between topics or segments, include a one-sentence bridge that tells the viewer why the next section matters. "Now that you know X, here is why Y changes everything" is a simple structure that carries momentum across cuts.
Fix 5: Trim the Sponsorship Read or Move It. Mid-roll sponsorship segments are a documented drop-off point. If you cannot remove them, shorten them to under 45 seconds and place them at a natural content break rather than mid-thought. Some creators see better retention by moving the sponsor to the final third of the video.
Fix 6: Replace Filler B-Roll With Active Visuals. B-roll with no narration and no on-screen text is a retention risk. Every visual should either reinforce the point being made or advance the story. If you are using b-roll as a visual rest, add a brief text overlay or a voiceover line to keep the information density consistent.
Fix 7: Use Chapter Markers to Set Expectations. Chapter markers in the description give viewers a mental map of the video. When viewers know what is coming, they are less likely to leave during a slower section because they can see the payoff is close. Chapters also let returning viewers skip to the relevant part, which can increase total watch time across multiple sessions.
Fix 8: End Sections With a Micro-Tease. At the end of each major section, give a one-sentence preview of what comes next. This is the serial structure that makes episodic content addictive. Applied to a single video, it functions as a chain of small commitments: the viewer agrees to watch one more section at a time.
Fix 9: Remove the Dead Zone at the End. Many videos have 30 to 90 seconds of filler after the main content ends: repeated summaries, extended outro music, or channel promotion that drags. Cut the video when the content is done. A tight ending preserves your average view duration and leaves the viewer with a clean final impression.
Audience Retention Improvement Checklist
Check off each item that applies to your video format before uploading.
All video types:
- First sentence names a specific outcome or creates tension
- No logo animation or subscribe reminder in the first 15 seconds
- At least one pattern interrupt per 90 to 120 seconds of runtime
- Every scene transition includes a forward-pull bridge
- Video ends within 10 seconds of the final content point
Tutorial and how-to videos:
- Steps are numbered on-screen, not just in narration
- Each step ends with a visible result or confirmation
- Sponsorship (if any) is placed at a natural break, not mid-step
Educational and explainer videos:
- Opening uses a counterintuitive or surprising statement
- Each section has a clear "so what" sentence before moving on
- Chapter markers are added for videos over 8 minutes
Vlogs and documentary-style videos:
- Visual action or conflict appears in the first 10 seconds
- Narration frames context without replacing visual storytelling
- Pacing varies: at least one slow moment and one fast-cut sequence
Faceless and voiceover channels:
- Script is written at a conversational pace, not a reading pace
- Visuals change at least every 4 to 6 seconds
- Open loops are planted in the first 60 seconds and closed before the video ends
Using Analytics to Shape Your Content Strategy
Retention data is only useful if it feeds back into your production decisions. The creators who improve fastest are not the ones who watch their analytics most often. They are the ones who have a system for translating data into specific script and editing changes.
The framework below gives you that system. It runs on a four-step cycle that repeats after every video.
The Observe, Diagnose, Test, Measure Framework
Step 1: Observe. After each video reaches 500 views, open the retention graph and note the three biggest drop points by timestamp. Do not interpret yet. Just record the timestamps and the approximate percentage lost at each one.
Step 2: Diagnose. For each timestamp, watch the 30 seconds before and after that point in your video. Identify the cause using one of three categories: pacing dropped, topic shifted without a bridge, or visual density fell. Write a one-sentence diagnosis for each drop point.
Step 3: Test. In your next video of the same format, apply one fix from the diagnosis, not all of them simultaneously. Testing one variable at a time is slower than applying every fix at once, but it gives you reliable information about what is actually driving your retention. Applying five changes simultaneously and seeing improvement tells you nothing about which change mattered.
Step 4: Measure. Check the retention graph on the new video at the same timestamps you flagged in Step 1. If the curve is flatter at that point, the fix worked. If not, the cause was something else and you test the next hypothesis in the following video.
For faceless channels and channels with consistent formats, this cycle compounds quickly. Within 10 to 15 videos, you will have a personal retention playbook: a short list of the specific triggers that cause your audience to leave and the specific edits that prevent it. That playbook is more valuable than any general advice because it is built from your actual viewer behavior.
OverseerOS helps creators reverse-engineer successful channels, decode what is already working, and turn those patterns into content plans. When you combine that channel-level pattern data with your own retention analytics, you move from guessing to testing with a much shorter feedback loop.
One pattern worth noting from high-performing videos across many niches: the strongest retention is not always found in the most polished productions. It shows up consistently in videos where the information density stays high and the pacing matches the viewer's expected tempo for that content type. A fast-cut gaming video and a slow-burn documentary can both hold 60 percent retention if the pacing fits the format. Matching your editing rhythm to your audience's expectation is a retention lever that most creators underuse.
Related guides
For a deeper breakdown of YouTube hook framework, see The YouTube Hook Framework: 7 Openings That Keep Viewers Watching.
For more on YouTube title formulas, read YouTube Title Formulas That Actually Get Clicks: 12 Patterns From High-Performing Videos.