Why does one YouTube video get 10,000 views while another video from the same channel gets 200,000?
Creators usually reach for an easy explanation.
The title was shorter.
The video was longer.
It had a number in the title.
It was posted at the right time.
The algorithm "picked it up."
We tested several of those visible explanations against real channel-relative performance.
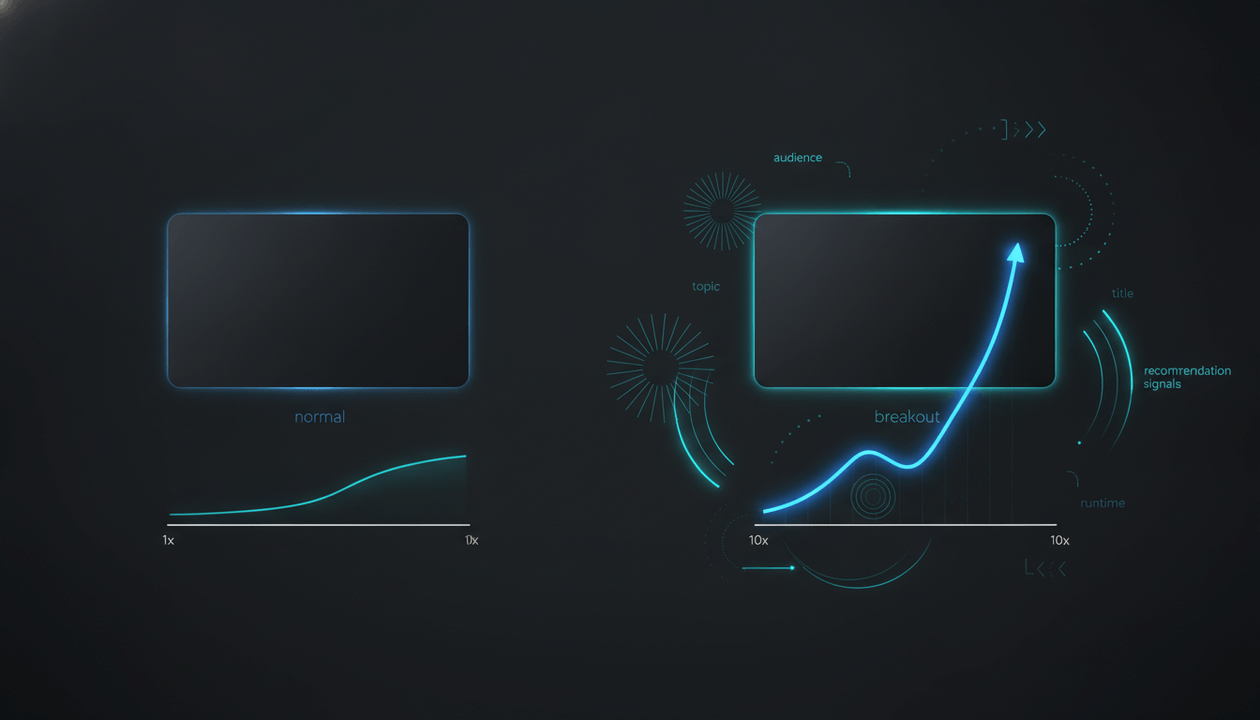
OverseerOS analyzed 3,305 YouTube videos between 31 and 180 days old, separating them into four performance groups based on how far each video had moved beyond its own channel baseline.
The strongest group contained 1,701 videos performing at least 5x above baseline.
The control group contained 481 videos sitting almost exactly at normal channel performance, between 0.9x and 1.1x baseline.
The median strong breakout was at:
13.77x baseline.
The median normal video:
1.00x.
But here is the surprising part.
When we controlled for the video's own channel and content format, the winning videos were not dramatically different in title length or runtime.
In a metadata-complete subset:
- Median long-form breakout title length relative to its own channel norm: 1.00x
- Median normal long-form title length relative to channel norm: 1.00x
- Median long-form breakout runtime relative to channel norm: 1.00x
- Median normal long-form runtime relative to channel norm: 1.02x
- Median short-form breakout runtime relative to channel norm: 1.00x
Huge performance differences existed without huge differences in these simple surface variables.
That leads to the central finding:
What separates a YouTube breakout from a normal upload is unlikely to be a universal title-length formula, video-length formula, or other simple metadata rule.
YouTube's own documentation points toward a more complex system built around viewer response, personalization, topic interest, competition and satisfaction.
Our public-data study cannot see another creator's private CTR or retention.
But it can tell us something important:
The visible shell of a breakout can look surprisingly normal.
The difference may be hiding inside the idea, packaging, audience response and distribution context.
Key Findings
| Finding | Result |
|---|---|
| Videos analyzed | 3,305 |
| Age window | 31-180 days |
| Normal-control videos | 481 |
| Notable performers, 1.5-2.99x | 628 |
| Near-breakouts, 3-4.99x | 495 |
| Strong breakouts, 5x+ | 1,701 |
| Median normal performance | 1.00x baseline |
| Median strong breakout | 13.77x baseline |
| Median views, normal group | 9,925 |
| Median views, strong group | 374,221 |
| Strong long-form title vs channel norm | 1.00x |
| Normal long-form title vs channel norm | 1.00x |
| Strong long-form runtime vs channel norm | 1.00x |
| Normal long-form runtime vs channel norm | 1.02x |
| Strong short-form runtime vs channel norm | 1.00x |
| Normal short-form runtime vs channel norm | 1.02x |
The important result is not that strong videos had more views.
That is built into the definition of a breakout.
The useful result is that several obvious visible characteristics did not move nearly as much as performance did.
The Direct Answer: Why Do Some YouTube Videos Get More Views Than Others?
YouTube videos can receive dramatically different view counts because the platform does not simply distribute every upload equally to a channel's subscriber base.
YouTube says videos are evaluated based on performance with viewers and personalized to individual viewing behavior. When a video is recommended, its systems can consider whether viewers choose to watch, whether they continue watching, average view duration, average percentage viewed and satisfaction-related signals. Topic interest, competition and seasonality can also affect distribution.
That means two videos from the same channel can encounter very different outcomes.
One topic may have more addressable demand.
One title-thumbnail combination may create a stronger reason to click.
One opening may fulfill the promise faster.
One video may satisfy the audience better.
One may face weaker competing videos.
One may connect with a larger adjacent audience.
And sometimes several of those things happen simultaneously.
Our study does not tell us which hidden factor caused each individual breakout.
It does show why looking for one universal metadata trick is probably the wrong level of analysis.
First, Stop Comparing Raw Views
Imagine two channels.
Channel A
Normal video:
2,000,000 views
New video:
2,500,000 views
Performance:
1.25x normal
Channel B
Normal video:
20,000 views
New video:
200,000 views
Performance:
10x normal
Which video contains the more unusual signal?
Raw views say Channel A.
Relative performance says Channel B.
This is why outlier analysis exists.
vidIQ similarly describes an outlier as a video performing significantly better than the channel's usual baseline rather than merely having a large raw view count.
The question is not:
Which video is biggest?
It is:
Which video behaved most differently from what normally happens on this channel?
That is the foundation of this study.
How We Built the Study
The analysis used public YouTube performance information captured through OverseerOS channel-analysis workflows.
We froze the primary dataset at:
August 17, 2026, 09:15 UTC.
Repeated observations of the same YouTube video were deduplicated using the latest available observation before the cutoff.
Why we used only 31-to-180-day-old videos
Our previous YouTube breakout analysis found that fresh videos need a different performance lens.
For a video only a few days old, velocity can reveal a breakout before raw views have accumulated.
For established videos, channel-relative accumulated views become more informative.
To avoid comparing those two metrics directly, this study restricts the primary comparison to:
31 to 180 days after publication.
Every group therefore uses the same median-relative performance signal.
The Four Performance Groups
Normal control
0.9x to 1.1x baseline
481 videos.
These videos performed almost exactly where the channel baseline suggested.
Notable
1.5x to 2.99x
628 videos.
Clearly above normal, but not yet major outliers.
Near-breakout
3x to 4.99x
495 videos.
Strong enough to deserve attention but below our strict 5x research threshold.
Strong breakout
5x or greater
1,701 videos.
These are the videos we treat as major channel-relative anomalies.
Finding 1: There Was a Huge Performance Gap
The four groups looked like this:
| Performance group | Videos | Median score | Median public views |
|---|---|---|---|
| Normal | 481 | 1.00x | 9,925 |
| Notable | 628 | 2.16x | 40,464 |
| Near-breakout | 495 | 3.84x | 105,727 |
| Strong breakout | 1,701 | 13.77x | 374,221 |
The raw view medians should not be interpreted as controlled causal comparisons.
The groups contain different channels, formats and ages within the 31-to-180-day window.
But they make the scale of the difference obvious.
The strong-outlier group was not slightly better than normal.
Its typical relative score was nearly:
14 times baseline.
The next question is where things become interesting:
Did those videos look radically different in simple, measurable ways?
Usually not.
Finding 2: Winning Long-Form Videos Were Not a Different Length
Among videos with duration metadata:
Normal long-form videos
Median runtime:
19 minutes, 29 seconds
Strong long-form breakouts
Median runtime:
17 minutes, 59 seconds
A difference exists in the pooled sample.
But pooled comparisons mix channels with different normal video lengths.
So we ran a better test.
For channels where at least five same-format videos were available, we divided each video's runtime by its own channel's median runtime.
Normal long-form videos
Median runtime ratio:
1.02x channel norm
Strong long-form breakouts
Median runtime ratio:
1.00x channel norm
That is effectively identical.
Strong breakouts were not typically:
- Half as long
- Twice as long
- Exactly eight minutes
- Exactly ten minutes
- Exactly twenty minutes
They were typically around the runtime their own channel already used.
This reinforces the result from our separate best YouTube video length study:
There is no evidence here for a universal breakout runtime.
Finding 3: The Same Thing Happened With Short-Form Runtime
For the duration-based short-form cohort:
Normal videos
Median:
43.5 seconds
Strong breakouts
Median:
34.5 seconds
Again, that pooled difference looks interesting.
Then we normalized against each channel's own same-format runtime.
Normal:
1.02x channel median
Strong breakouts:
1.00x channel median
The apparent difference almost completely disappeared at the median.
This is an important recurring lesson in YouTube research.
Cross-channel averages can manufacture rules that weaken when you compare videos inside their own context.
The same thing happened in our runtime study.
The same thing happened in our title-length study.
And it appears again here.
Finding 4: Breakout Titles Were Usually Close to the Channel's Existing Style
The pooled title data initially suggested a larger difference.
Long-form
Normal median:
47 characters
Strong-breakout median:
66 characters
That is a 19-character gap.
It looks like a headline:
Longer Titles Get More Views.
But when we normalized title length against the channel's own same-format median:
Normal long-form
1.00x channel title length
Strong long-form
1.00x
Exactly the same at the median.
The strong videos did not typically become radically longer relative to the style of the channel that published them.
Short-form
Normal:
1.00x channel norm
Strong:
1.02x
Again, extremely close.
The strong short-form group showed a wider range of title-length experimentation, but its median remained close to normal.
This makes the simplistic rule:
"Shorter titles go viral"
very difficult to defend.
So does:
"Longer titles get more views."
The evidence supports something more nuanced:
The title may need to change in meaning much more than it changes in character count.
Finding 5: Runtime Was Almost Identical in Same-Channel Winner-vs-Normal Checks
We also performed a stricter sanity check.
We looked only at channel-format groups containing both:
- At least one normal-control video
- At least one 5x+ breakout
Metadata coverage makes this a much smaller sample, so it should not be treated as the primary result.
But the runtime result was striking.
Matched long-form channels
Median breakout-to-normal runtime ratio:
1.002x
Essentially identical.
Matched short-form channels
Median:
1.00x
Again, identical.
Yet the median difference in views inside those same channel-format comparisons was large.
For the 12 matched long-form channel-format groups:
Median strong-to-normal views ratio:
13.5x
For the seven matched short-form groups:
9.57x
Small sample.
Huge difference in performance.
Almost no median difference in runtime.
That is exactly why surface-level optimization can be misleading.
Finding 6: There Was No Universal Title-Length Direction
The same matched-channel test produced another useful result.
Among 12 matched long-form channel groups:
- Strong titles were longer in 8
- Strong titles were shorter in 4
- Median difference: only +4.75 characters
Among seven matched short-form groups:
- Strong titles were longer in 3
- Strong titles were shorter in 4
- Median difference: -3.5 characters
There was no universal direction that worked across both formats.
That matters more than the pooled averages.
Because if the causal explanation were simply:
Make titles shorter.
we would expect a much cleaner pattern.
We did not find one.
Finding 7: Even Simple Punctuation Patterns Failed to Produce an Obvious Formula
We also explored visible title features in the metadata subset.
For example:
- Numbers
- Question marks
- Exclamation points
- Colons
- Parentheses
- Dollar signs
Some differences appeared.
But they were not stable enough across format and sample composition to justify a rule.
For example, numbers appeared at similar rates among normal and breakout long-form titles, while the direction changed in short-form.
Question marks were somewhat more common among strong winners in both format subsets, but the samples were far too limited to claim:
Add a question mark and your video will perform better.
That would be exactly the kind of false optimization this research is trying to avoid.
Punctuation can change the meaning and tone of a title.
But a punctuation mark is not a strategy.
Finding 8: The Breakout May Look Normal Because the Important Difference Is Semantic
Imagine these two titles:
I Tried Running Every Day for 30 Days
and:
I Ran Every Day Until My Body Started Fighting Back
Their lengths can be similar.
Their semantic promises are not.
Or:
10 AI Tools You Need to Try
versus:
These AI Tools Are Quietly Replacing Entire Jobs
Again, similar structural length.
Very different:
- Stakes
- Audience
- Curiosity
- Consequence
- Specificity
- Emotional frame
Character count cannot capture that.
Neither can runtime.
This is the central limitation of simplistic metadata research.
A title can remain 55 characters while the underlying idea becomes dramatically more clickable.
A video can remain 18 minutes while the underlying story becomes dramatically more satisfying.
The surface measurement barely moves.
The viewer proposition changes completely.
What YouTube Says Actually Matters
This is where the first-party platform documentation becomes important.
YouTube says its system does not favor one particular kind of video. Videos are ranked through a combination of performance and personalization.
When a video is recommended, YouTube says its systems can look at whether viewers:
- Choose to watch
- Ignore the recommendation
- Select "Not interested"
- Continue watching
YouTube also identifies average view duration, average percentage viewed, likes and post-watch satisfaction signals as inputs related to ranking.
And distribution does not happen in isolation.
YouTube explicitly identifies three external factors:
Topic interest
How much global audience demand exists around the subject.
Competition
How strongly other available videos are performing for the same viewer.
Seasonality
How audience behavior changes over time.
This means the outcome of a video is much closer to:
viewer × topic × packaging × experience × competition × context
than:
title = 55 characters
One Underperforming Video Does Not Automatically Poison the Channel
This is another useful implication.
Creators often panic when a video sits around baseline or underperforms.
YouTube says its systems rely more heavily on video-level and audience-level signals when deciding what to recommend, and one underperforming video does not automatically damage the whole channel.
That means a 1x video should be treated as information.
Not a catastrophe.
The right question is:
Why did this audience choose the 10x idea but respond normally to this one?
That comparison can teach you much more than asking why YouTube "stopped pushing" the channel.
The Most Valuable Competitor May Be the Same Channel
Most competitor research is done incorrectly.
A creator finds:
Channel A: 50 million subscribers
Then studies:
Channel B: 20 million subscribers
Then:
Channel C: 10 million subscribers
The problem is that almost everything changes simultaneously:
- Audience
- Brand
- Topic
- Style
- Format
- Production
- Subscriber count
- Upload history
- Personality
You cannot easily tell what matters.
There is a cleaner experiment hiding in public data:
Compare a breakout video with a normal video from the same channel.
Now much more stays constant.
The creator is the same.
The audience is more similar.
Production capability is more similar.
Brand recognition is more similar.
Channel history is more similar.
If both videos are also:
- Same format
- Similar age
- Similar period
the comparison becomes far more useful.
Not experimentally causal.
But much cleaner.
The Breakout-vs-Baseline Method
Here is the research workflow.
Step 1: Pick one channel
Prefer a channel serving the audience you actually want.
Step 2: Establish its normal performance
Use the median rather than blindly relying on one average distorted by giant hits.
Step 3: Find the 5x+ winners
These are the obvious anomalies.
Step 4: Find 0.9x-to-1.1x videos
These are your controls.
Not failures.
Normal performance.
Step 5: Match format
Compare:
Short to Short.
Long-form to long-form.
Podcast to podcast.
Tutorial to tutorial where possible.
Step 6: Match age
Do not compare a 10-day-old upload with a three-year-old video without adjusting for lifecycle.
Step 7: Compare what actually changed
Now investigate:
- Topic
- Core promise
- Audience desire
- Stakes
- Novelty
- Title language
- Thumbnail concept
- Title-thumbnail relationship
- Opening hook
- Story architecture
- Format
- Timing
- Specificity
Do not begin with character count.
Begin with meaning.
A Practical Example
Imagine one channel has these two videos.
Normal performer
Title: How I Organize My Money Every Month
Performance:
1.02x baseline
Breakout
Title: I Tracked Every Dollar for 10 Years. Here's What I Regret
Performance:
11.8x baseline
They might have similar:
- Length
- Production quality
- Presenter
- Thumbnail style
- Runtime
But the audience proposition changed.
The breakout contains:
Proof
10 years.
Specificity
Every dollar.
Cost
Regret.
Open loop
What did the creator learn?
That is the level of analysis that character count cannot reach.
Do Not Reverse-Engineer the Wrong Difference
Suppose you discover:
Normal video:
20 minutes
Breakout:
17 minutes
It is tempting to decide:
Make every future video 17 minutes.
But our data shows why that is dangerous.
After channel normalization, strong long-form breakouts were almost exactly normal length at the median.
So ask:
What meaningful variable changed?
before:
What measurable variable changed?
Not every difference is responsible for the outcome.
A Better Diagnosis for a Video That Did Not Get Views
If your own video underperforms, you have something competitor analysis cannot access:
YouTube Studio.
Use it.
Problem 1: Low impressions
Investigate:
- Topic demand
- Audience fit
- Competition
- Whether the system has enough relevant viewer history
- Whether interest has declined
YouTube notes that strong internal metrics do not guarantee more impressions when topic demand is small or competing videos are performing even better.
Problem 2: Impressions but weak clicking
Investigate:
- Title
- Thumbnail
- Promise
- Specificity
- Audience relevance
- Packaging mismatch
Do not immediately change runtime.
The viewer has not watched yet.
Problem 3: Clicks but weak viewing
Investigate:
- Opening
- Promise fulfillment
- Pacing
- Structure
- Expectation mismatch
- Excess setup
- Weak storytelling
YouTube explicitly says average view duration and average percentage viewed can inform ranking.
Problem 4: Strong metrics but distribution stalls
Consider external context:
- Topic ceiling
- Competition
- Seasonality
- Audience saturation
Again, YouTube itself identifies all three as external distribution factors.
Problem 5: One video exploded, the next did not
Do not assume the channel is broken.
Compare the audience desire.
A viral video's viewers may have been interested primarily in that specific topic rather than the creator's entire catalog.
YouTube's performance FAQ explicitly notes that channels can see traffic decline after a high-performing or viral video when those viewers do not return for more.
That is a content-market problem worth studying.
Public Competitor Research vs Private Analytics
The two should solve different problems.
Your own YouTube Studio
Best for:
- Impressions
- CTR
- Retention
- Watch time
- Traffic source
- Returning viewers
- Audience demographics
- Subscriber behavior
Public competitor research
Best for:
- Channel-relative views
- Breakout identification
- Topic patterns
- Title patterns
- Thumbnail patterns
- Format
- Upload timing
- Publication age
- Cross-channel confirmation
Do not pretend public competitor data contains private retention.
And do not ignore public competitor data just because it cannot.
The strongest workflow uses both.
How to Do Breakout-vs-Normal Research With OverseerOS
1. Find channels producing real outliers
OverseerOS Viral Channel Finder searches recent public YouTube signals and lets you filter discovered channels by niche, subscriber count, video count, language and format. It also exposes the breakout videos behind each result rather than only returning channel names.
The goal is not:
Find the biggest creator.
It is:
Find channels with abnormal recent performance.
2. Establish the baseline
Send the channel into OverseerOS Channel Analyzer.
The analyzer uses public video and channel information to show top performers, recent uploads, view distributions and breakout patterns while preserving the surrounding channel context.
Now select:
one 5x+ winner
and:
one normal performer
from the same channel.
Prefer the same format and similar age.
3. Reverse-engineer the delta
Use OverseerOS Reverse Engineer on the reference worth studying.
The feature is designed to extract transferable patterns from public or user-provided titles, transcripts, thumbnails, hooks and structures, then use those patterns as a starting point for an original execution rather than copying the source.
Now ask:
What changed between normal and breakout?
Not:
What does the breakout look like in isolation?
That second question is much weaker.
The Breakout Delta Checklist
When comparing a winner with a normal video from the same channel, inspect:
Topic
- Broader demand?
- Emerging demand?
- Stronger recurring problem?
- More universal curiosity?
- Better timing?
Promise
- Larger outcome?
- More specific?
- More surprising?
- Higher stakes?
- More concrete proof?
Title
- Different angle?
- Stronger verb?
- Better specificity?
- More tension?
- Better audience identification?
Thumbnail
- Clearer focal point?
- More contrast?
- Stronger visual question?
- Better title-thumbnail complementarity?
- Less cognitive load?
Hook
- Promise delivered faster?
- Stakes established earlier?
- More unanswered questions?
- Better proof?
Structure
- Less setup?
- Stronger escalation?
- Better payoff sequence?
- More frequent information change?
Market
- Less competition?
- Larger active demand?
- New event?
- Trend?
- Seasonal effect?
That is a much stronger diagnostic system than:
The breakout was four minutes shorter.
The Best Research Pair Is Not Winner vs Winner
There is a deeper principle here.
If you compare:
viral video vs viral video
you mostly learn what successful videos have in common.
That can be useful.
But if you compare:
viral video vs normal video from the same creator
you can study what changed.
That is a different research question.
And often a better one.
In experimentation language, the normal upload acts as an imperfect observational control.
Not a true randomized control.
But significantly better context than an unrelated competitor.
Why This Matters for AI YouTube Research
AI systems are very good at finding patterns.
They are also very good at hallucinating patterns when you feed them only winners.
Give an AI 20 viral titles and ask:
What do these have in common?
It will always find something.
Numbers.
Curiosity.
Capitalization.
Emotional language.
Short sentences.
Long sentences.
Whatever is available.
But you do not know whether those features are unique to the winners.
Maybe the channel uses the same pattern on every upload.
A better prompt is:
Here are 20 breakouts and 20 normal videos from the same channels. What distinguishes the groups, and which differences remain after accounting for channel and format?
Now the model has contrast.
Contrast creates information.
That is how competitor research should evolve.
What This Study Does Not Prove
It does not identify the causal reason each breakout succeeded
We cannot see another creator's private:
- Impressions
- CTR
- Retention
- Watch time
- Traffic source
- Satisfaction surveys
- Returning viewers
- Browse distribution
- Suggested distribution
Those variables may explain the actual performance difference.
It does not prove title length is irrelevant
Title length can affect readability and packaging.
Our finding is narrower:
Strong breakouts did not consistently move far away from their own channel's normal title length.
It does not prove runtime is irrelevant
Runtime can influence viewer experience.
Again, our finding is narrower:
Breakouts were usually close to their channel's normal same-format runtime at the median.
The dataset is observational
A feature associated with a winning video does not mean that feature caused the win.
The 31-to-180-day window still contains different ages
Normal-control videos had a median age of:
79 days
Strong breakouts:
122 days
We restricted the study to one scoring regime, but age differences still remain.
Do not interpret pooled raw views as a causal comparison.
Metadata coverage is incomplete
The title and duration analyses use the subset of breakout/control videos available in the newer research metadata layer.
We disclose those subset sizes rather than pretending every one of the 3,305 videos had identical metadata coverage.
Multiple videos can come from the same channel
Videos from one creator are not statistically independent.
That is why we added same-channel, same-format sanity checks where canonical channel identity and metadata were available.
Those matched samples are smaller and should be treated accordingly.
This is not a random sample of YouTube
The videos came from channels encountered through OverseerOS analysis workflows.
The sample reflects what users chose to analyze rather than a random census of the platform.
Final Verdict
Why do some YouTube videos get more views than others?
There is no single visible variable that explains the difference.
In our analysis of 3,305 established videos, strong breakouts reached a median:
13.77x channel baseline
while normal-control videos sat at:
1.00x.
Yet when we normalized simple visible features against each video's own channel and format:
Title length remained around 1.00x normal.
Runtime remained around 1.00x normal.
In small same-channel comparisons, performance differed by roughly 10x to 13x while median runtime barely changed at all.
That does not prove title and runtime do not matter.
It proves they are inadequate explanations by themselves.
YouTube's own documentation points to a system influenced by:
- Viewer choice
- Viewing behavior
- Satisfaction
- Personalization
- Topic demand
- Competition
- Seasonality
So the next time one competitor video gets 10 times more views than another, do not start by counting characters.
Start with the delta in the viewer proposition.
Ask:
What audience desire changed?
What promise changed?
What made this package more compelling?
What happened after the click?
What competing options existed?
And most importantly:
What changed between this breakout and the normal videos from the same channel?
That comparison gets much closer to the real question.
Not:
What does a viral video look like?
But:
What became different enough for viewers to respond differently?
FAQ
Why do some YouTube videos get more views than others?
YouTube says video distribution depends on performance with viewers, personalization and external factors such as topic interest, competition and seasonality. Videos from the same channel can therefore receive very different distribution depending on how viewers respond and how much demand exists.
Why did one of my YouTube videos suddenly get more views?
A sudden increase can happen when a video finds a larger relevant audience, performs strongly with viewers, connects with growing topic interest or becomes competitive on recommendation surfaces. YouTube's public documentation does not provide one universal viral trigger.
What makes a YouTube video an outlier?
An outlier is a video performing substantially above the normal baseline of the channel that published it. For this OverseerOS study, strong outliers were established videos performing at least 5x above their relevant channel-relative median baseline.
What is a good YouTube outlier score?
A score around 1x represents normal channel performance. In our research framework, 1.5x to 2.99x is notable, 3x to 4.99x is an emerging or near-breakout signal, and 5x+ is treated as a strong outlier worth deeper investigation.
Is 2x views a viral video?
Not necessarily. A 2x video is meaningfully above baseline, but we would not normally classify it as a major breakout. Absolute scale, channel size, video age and format still matter.
Is a 5x YouTube outlier good?
Yes. A video earning five times its relevant channel baseline is a strong public performance anomaly and is usually worth investigating for transferable topic, packaging and structural patterns.
Do shorter YouTube videos get more views?
Not universally. In this study, strong long-form breakouts had a median runtime almost exactly equal to their own channel's normal same-format runtime after normalization.
Do shorter YouTube titles get more views?
Our data does not support a universal rule. Breakout title length was typically close to each channel's normal same-format title length. See our separate study of 942 YouTube breakout titles.
Does one bad YouTube video hurt your whole channel?
YouTube says an individual underperforming video does not automatically penalize the whole channel. Recommendations rely heavily on video-level and audience-level signals.
Why is my YouTube video getting impressions but no views?
If impressions are present but few people choose to watch, title, thumbnail, topic relevance or the promise itself are logical areas to investigate. YouTube says viewer choice when a recommendation is shown is part of how video performance is evaluated.
Why is my YouTube video getting clicks but not more views?
If viewers click but leave quickly, investigate whether the opening fulfills the packaging promise, pacing, structure and retention. YouTube says average view duration and average percentage viewed are signals used in video ranking.
Can a good YouTube video still get low views?
Yes. YouTube notes that topic interest and competition affect potential impressions, so a video can have strong internal performance metrics but still face limited audience demand or stronger competing options.
How do I compare a viral video with a normal video?
Compare videos from the same channel, same format and similar age. Establish the channel baseline first, then examine differences in topic, promise, title, thumbnail, hook, structure and timing rather than comparing raw views alone.
What is the best way to research YouTube competitors?
Find channel-relative outliers, then compare them with normal videos from the same creator. Cross-check the pattern across other channels before adapting the underlying audience insight into an original concept.
What matters more than video length or title length?
Audience demand, the content promise, packaging, viewer response, satisfaction, competition and how well the actual video fulfills the reason viewers clicked are more useful areas to investigate than relying on a universal character count or runtime formula. YouTube's own search and discovery documentation emphasizes viewer performance, personalization and external market factors.