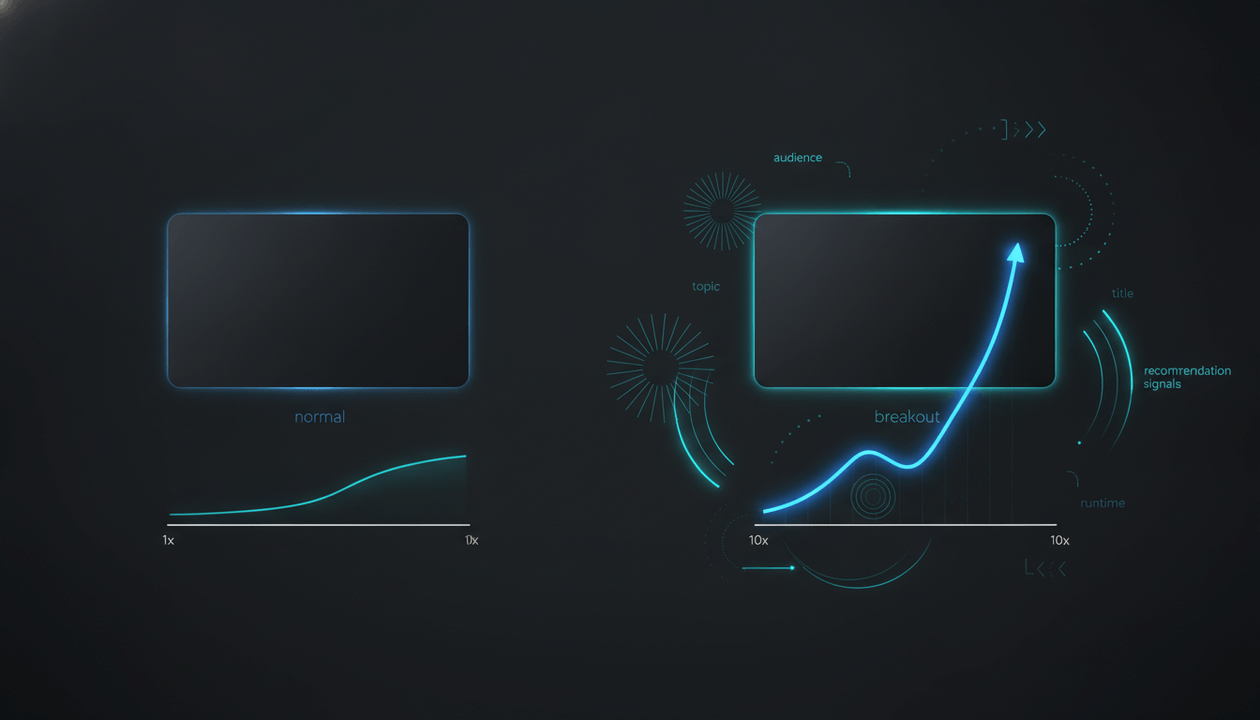
Inconsistent YouTube views are not automatically a sign that your channel is broken.
In the OverseerOS analysis of 1,555 mature long-form videos across 42 public YouTube channels, large swings between videos were the norm rather than the exception.
On the median channel:
- The 25th-percentile video received only 0.439x the median
- The 75th-percentile video received 2.315x the median
- The middle 50% of videos spanned a 5.04x performance range
- The 90th-percentile video reached 5.10x the median
- The average view count was 2.04x the median, showing how strongly winners distorted the arithmetic average
- The biggest video reached 14.34x the median
We then tested what happened from one upload to the next.
Across 1,147 consecutive-video pairs from 40 channels, the median channel's typical adjacent pair differed by:
2.81x.
And on an equal-channel basis:
- 62.5% of consecutive pairs differed by at least 2x
- 29.5% differed by at least 5x
- 15.9% differed by at least 10x
So if one video gets 100,000 views and the next gets 30,000, that does not automatically mean the algorithm stopped recommending your channel.
It may simply be normal YouTube performance variance.
The better question is:
Is the new video below your normal performance range, or are you comparing it with an unusually successful outlier?
That distinction changes everything.
Key Findings
| Finding | OverseerOS result |
|---|---|
| Mature long-form videos in primary analysis | 1,555 |
| Public channels in primary analysis | 42 |
| Minimum qualifying videos per channel | 20 |
| Median P25 performance vs channel median | 0.439x |
| Median P75 performance vs channel median | 2.315x |
| Median middle-50% performance spread | 5.04x |
| Median P90 performance vs channel median | 5.10x |
| Median channel mean/median ratio | 2.04x |
| Median largest-video/median ratio | 14.34x |
| Channels where middle 50% spanned at least 2x | 40 of 42 |
| Channels where middle 50% spanned at least 5x | 21 of 42 |
| Consecutive mature-video pairs analyzed | 1,147 |
| Channels in consecutive-upload analysis | 40 |
| Median adjacent-video difference | 2.81x |
| Adjacent pairs differing by at least 2x | 62.5% |
| Adjacent pairs differing by at least 5x | 29.5% |
| Adjacent pairs differing by at least 10x | 15.9% |
| Later video outperforming previous video | 48.1% |
The most useful finding is:
On the median channel, even the middle half of mature long-form videos occupied roughly a fivefold performance range.
YouTube views were not distributed around one narrow "normal" number.
They were highly uneven.
Why Are My YouTube Views So Inconsistent?
Because different videos can perform very differently even when they come from the same channel.
Our data suggests that expecting every upload to land near one stable average is unrealistic.
Consider a channel with a median of:
10,000 views.
Using the median channel-level percentile ratios from our study as a rough illustration, its distribution could look something like:
| Performance level | Approximate views |
|---|---|
| 10th percentile | 2,570 |
| 25th percentile | 4,390 |
| Median | 10,000 |
| 75th percentile | 23,150 |
| 90th percentile | 50,960 |
These are illustrative values created by applying our median ratios to a hypothetical 10,000-view baseline.
They are not a forecast for every channel.
But they show the scale of the variation we observed.
A creator could publish:
4,000 views
11,000 views
27,000 views
6,000 views
52,000 views
9,000 views
without those numbers necessarily representing six different states of channel health.
Some may simply represent the natural spread between weak, normal, strong, and breakout topics.
Finding 1: The Middle 50% of Videos Spanned 5x
We deliberately started with the middle of the distribution instead of the biggest viral video.
For every channel, we calculated:
- 25th percentile views
- Median views
- 75th percentile views
Then:
Middle-50% spread =
75th percentile views
÷
25th percentile views
The median channel produced a:
5.04x spread.
That means even after largely ignoring the extreme top and bottom of the catalog, YouTube performance was still highly variable.
This is important.
A creator might assume inconsistency is being caused by:
one crazy viral video.
Sometimes it is.
But our results show that substantial variance existed even within the central half of the catalog.
How common was a wide performance range?
Among the 42 channels:
40 of 42
had a middle-50% spread of at least:
2x.
34 of 42
had at least:
3x.
21 of 42
had at least:
5x.
And:
11 of 42
had at least:
10x.
So half the channels had at least a fivefold gap between their 25th and 75th percentile videos.
That is not a tiny fluctuation.
It is a fundamentally uneven performance distribution.
Finding 2: Strong Videos Were Much Further Above Normal Than Weak Videos Were Below It
The asymmetry was interesting.
On the median channel:
10th percentile
0.257x median
25th percentile
0.439x median
75th percentile
2.315x median
90th percentile
5.096x median
The upside stretched much further than the downside.
That makes sense mathematically.
A video cannot receive less than zero views.
But the upside has no similar ceiling.
A normal video might receive:
10,000.
A weak video could fall to:
2,000.
But a breakout could reach:
100,000
or:
1 million.
This creates the highly skewed distributions we repeatedly see in YouTube channel analysis.
It also explains why one strong video can completely change how a creator perceives everything that follows.
Finding 3: One Upload to the Next Was Extremely Unpredictable
Distribution statistics are useful.
But creators experience inconsistency differently.
They experience:
My last video did great. Why did this one flop?
So we ran a second analysis.
We restricted videos to mature long-form uploads between approximately 90 and 730 days old and required enough qualifying videos to establish a meaningful sequence.
That produced:
- 40 channels
- 1,147 consecutive-video pairs
For each adjacent pair, we calculated:
Adjacent-video difference =
Larger video's views
÷
Smaller video's views
The median channel's median adjacent-video difference was:
2.81x.
In practical terms, if one video received:
20,000 views
a typical adjacent difference of 2.81x could mean the neighboring upload landed around:
7,100
or:
56,200
depending on which direction the difference moved.
That is a huge swing.
Finding 4: Nearly One-Third of Consecutive Uploads Differed by at Least 5x
Across channels with equal weighting:
62.5%
of consecutive mature-video comparisons differed by at least:
2x.
Almost:
29.5%
differed by:
5x or more.
And:
15.9%
differed by:
10x or more.
That means a sequence such as:
12K
70K
9K
18K
140K
11K
is not automatically evidence of a broken channel.
It may represent a channel where certain ideas dramatically outperform others.
The important question becomes:
Why did the 70K and 140K videos escape the baseline?
Not:
How do I force every video to receive 70K?
Those are very different strategic questions.
Finding 5: Inconsistency Did Not Move Reliably in One Direction
Maybe the variability simply reflected channels declining.
If that were true, we would expect the later video in each pair to lose most of the time.
It did not.
Across our equal-channel comparison, the later video had more cumulative views in:
48.1%
of adjacent pairs.
That is close to an even split.
Because the later upload is also younger and therefore has had slightly less time to accumulate views, we should not interpret 48.1% as an exact probability.
But the broad pattern matters.
The sequence was not simply:
high
lower
lower
lower
lower
The data contained large movements in both directions.
A bad upload could be followed by a huge winner.
A huge winner could be followed by a normal upload.
That is precisely why one-video diagnosis is so dangerous.
Finding 6: Your Average Can Make Normal Videos Look Like Failures
Across the 42 channels, the median channel's arithmetic mean was:
2.04 times its median.
That means the average was typically pulled upward by high-performing videos.
Suppose your actual catalog looks like:
8K
9K
10K
10K
11K
12K
15K
18K
100K
300K
Median:
roughly:
10.5K.
Average:
roughly:
49K.
If you start telling yourself:
My channel averages 49,000 views.
then a perfectly normal:
12,000-view upload
will feel like a catastrophic failure.
But it is not.
Your expectation is distorted.
This is exactly why our research on average views per YouTube video recommends using the median as the primary baseline when you are trying to understand what a typical video does.
Use the mean to understand total catalog output.
Use the median to understand normal performance.
Finding 7: The 90th-Percentile Video Was 5x the Median
On the median channel:
P90 = 5.10x the median.
And:
22 of 42 channels
had a 90th-percentile video that was at least:
5x the median.
On:
10 of 42 channels
the 90th percentile was already:
10x or higher.
This helps explain why creators develop unrealistic expectations after a winning period.
If you publish one of your top 10% videos, you may temporarily see:
five times normal performance.
Then the next upload returns to:
1x.
Emotionally, that feels like:
My views collapsed 80%.
Statistically, it may be:
The breakout ended and the channel returned to its baseline.
Those interpretations lead to completely different decisions.
The Most Dangerous YouTube Analytics Mistake: Using an Outlier as Your New Baseline
Imagine your normal median is:
20,000 views.
Then one video receives:
250,000.
That is:
250K ÷ 20K = 12.5x
Now the next video receives:
24,000.
Compared with the viral video:
24K vs 250K
=
90.4% decline
Terrifying.
Compared with the actual baseline:
24K ÷ 20K
=
1.2x normal
Completely healthy.
Nothing has to be broken.
You may simply be comparing:
normal
with:
exceptional.
Our YouTube 80/20 study found exactly why this happens. A relatively small group of videos can generate a disproportionately large share of a channel's total views.
Once a winner changes your reference point, normal performance starts feeling bad.
Finding 8: Smaller Channels Showed More Extreme Upside Variability
We divided the 42-channel primary cohort into:
- Channels below 100K current subscribers
- Channels with 100K or more
Below 100K
20 channels
753 mature long-form videos
Median middle-50% spread:
5.26x
90th percentile vs median:
5.74x
Mean vs median:
2.81x
Largest video vs median:
20.10x
100K+
22 channels
802 mature long-form videos
Median middle-50% spread:
4.67x
90th percentile vs median:
3.70x
Mean vs median:
1.72x
Largest video vs median:
12.12x
The middle of the distributions was volatile in both groups.
The more noticeable difference appeared at the top.
Smaller channels had larger winner multiples.
That matches our separate analysis of whether small YouTube channels can go viral, where relative 5x and 10x outliers also appeared more frequently among smaller channels in the qualifying sample.
Current subscriber count is not historical subscriber count, so this does not prove that being small causes volatility.
But it does reinforce an important practical point:
Small channels should expect unusually successful videos to distort their perception of normal performance.
Finding 9: Consecutive Uploads Were More Volatile on Smaller Channels Too
We repeated the adjacent-video comparison by current channel size.
Under 100K subscribers
- Channels: 18
- Consecutive pairs: 537
- Median adjacent difference: 3.26x
- Pairs differing by 5x+: 33.6%
- Pairs differing by 10x+: 19.3%
100K+ subscribers
- Channels: 22
- Consecutive pairs: 610
- Median adjacent difference: 2.56x
- Pairs differing by 5x+: 26.1%
- Pairs differing by 10x+: 13.1%
Both groups were inconsistent.
The smaller-channel group was somewhat more extreme.
Again, that should not be read as:
Small channels are unstable because YouTube does not trust them.
Our public data cannot establish that mechanism.
The safer interpretation is:
Channels below 100K in this sample showed greater video-to-video variation in mature public views.
Finding 10: The Pattern Survived When We Focused on a Recent Channel Era
A legitimate criticism of the primary analysis is that some channels have long histories.
Maybe a channel changed:
- Niche
- Audience
- Production quality
- Host
- Format
- Topic strategy
over several years.
That could artificially inflate variability.
So we repeated the analysis using only qualifying videos between:
90 and 365 days old
and required at least 15 videos in that tighter window.
That produced:
690 videos across 27 channels.
The result:
| Metric | Full mature sample | 90-365-day sensitivity |
|---|---|---|
| Middle-50% spread | 5.04x | 4.56x |
| P90 vs median | 5.10x | 4.85x |
| Mean vs median | 2.04x | 2.28x |
| Maximum vs median | 14.34x | 16.93x |
The exact values moved.
The central conclusion survived.
Even inside a much tighter publishing era:
YouTube video performance remained highly uneven.
So the variability was not simply created by comparing a creator's ancient videos with their current channel.
What Actually Causes Inconsistent YouTube Views?
Our public-data analysis measures the inconsistency.
It cannot identify the private causal mechanism behind every individual video.
But when diagnosing your own channel, these are the major variables worth investigating.
1. Topic Demand
Two videos can have:
- The same creator
- The same production quality
- The same editing
- The same thumbnail style
and still have radically different audience potential.
Example:
Video A:
How I Organize My Notion Dashboard
Video B:
I Tried Every AI Productivity Tool for 30 Days
The second idea may simply address a broader or more timely viewer desire.
A channel is not publishing into a fixed-size market every time.
Every topic has a different potential audience.
2. Title and Thumbnail Strength
A strong video behind weak packaging can struggle to earn the click.
Compare:
My New Editing Workflow
with:
I Cut My Editing Time From 8 Hours to 90 Minutes
Same underlying subject.
Different promise.
Likewise, two thumbnails can communicate the same video with radically different clarity.
If impressions are healthy but views collapse, packaging deserves immediate investigation.
3. Audience Fit
A topic can be objectively interesting but wrong for the audience the channel has trained.
Imagine a channel built around:
YouTube growth research
suddenly publishes:
My Morning Routine in Stockholm.
The creator has not necessarily become worse.
The content is simply making a different promise to a different viewer.
4. Competition
Your upload does not exist in isolation.
A topic can become harder when:
- More creators cover it
- A giant channel publishes a stronger version
- The market becomes saturated
- The viewer has already seen the same promise repeatedly
This is why competitor research matters before production, not only after a video fails.
5. Timing
The same idea can have very different demand at different moments.
Some topics are:
- Seasonal
- News-sensitive
- Trend-sensitive
- Product-launch-sensitive
- Event-driven
An excellent video can underperform when audience attention has moved elsewhere.
6. The Previous Video Was an Outlier
This is one of the easiest causes to miss.
Your current video may be normal.
The previous one may have been abnormal.
If your previous upload was:
8x baseline
and the new one is:
1.1x
the visual chart looks terrible.
But the strategic conclusion is not:
Fix the 1.1x video because the channel is dying.
It may be:
Study the 8x video because something exceptional happened.
How to Tell Whether Your Views Are Actually Declining
Do not diagnose from two videos.
Use a rolling baseline.
Step 1: Choose comparable videos
Use:
10 to 20 recent videos
at minimum when possible.
Our YouTube channel analysis sample-size study found that tiny samples can produce badly distorted channel baselines.
Keep the comparison set consistent by:
- Format
- Channel era
- Video age
- Topic family where relevant
Do not mix Shorts with long-form.
Step 2: Calculate the median
Example:
Recent long-form views:

18K
21K
25K
16K
22K
90K
19K
24K
20K
110K
The giant winners should not become the definition of normal.
Calculate the median.
That becomes your working baseline.
Step 3: Compare at Equal Ages
For a channel you own, this is much better than comparing current lifetime totals.
Compare videos at:
- First 24 hours
- First 7 days
- First 28 days
- First 90 days
Do not compare:
a three-day-old upload
with:
a two-year-old video
using lifetime views.
Step 4: Calculate Relative Performance
Use:
Relative performance =
Video views at chosen age
÷
Median views of comparable videos at the same age
Then classify.
| Relative result | Practical interpretation |
|---|---|
| Under 0.5x | Material underperformance |
| 0.5x-0.8x | Below normal |
| 0.8x-1.2x | Around baseline |
| 1.2x-2x | Above normal |
| 2x-5x | Strong outlier |
| 5x+ | Major breakout |
These are practical research bands.
They are not official YouTube classifications.
Step 5: Look at the Sequence, Not One Video
Suppose your relative performance is:
0.8x
1.2x
0.7x
1.1x
0.9x
That looks like normal variance.
Now suppose:
1.1x
0.8x
0.5x
0.4x
0.3x
That deserves investigation.
The difference is:
pattern.
A single miss is noise.
Repeated deterioration can become evidence.
The YouTube View-Drop Diagnostic
When a video underperforms, diagnose the layer that changed.
| What changed? | What to investigate |
|---|---|
| Views down, impressions down | Topic demand, audience fit, competition, distribution |
| Impressions stable, CTR down | Title and thumbnail |
| CTR healthy, retention weak | Hook, pacing, expectation mismatch |
| CTR and retention healthy, reach weak | Topic ceiling, competition, audience size |
| One video down after a huge winner | Possible return to baseline |
| Several comparable videos down | Possible real channel-level change |
| Only one topic family down | Topic problem rather than channel problem |
| Views fluctuate both up and down | May be normal channel variance |
For channels you own, use your private YouTube Analytics to diagnose these layers.
Public competitor data can reveal the outcome.
Your own Analytics can reveal much more about the mechanism.
One Bad Video Does Not Prove Your Channel Is Dying
Consider:
Video 1: 22K
Video 2: 18K
Video 3: 130K
Video 4: 24K
If you compare Video 4 with Video 3:
Views fell 81.5%.
If you compare Video 4 with the original baseline:
Video 4 may actually be:
above normal.
This is why percentage-change screenshots can create panic.
The denominator matters.
Do not ask:
How much did I fall from my best recent video?
Ask:
Where does this upload sit inside my normal distribution?
When You Should Actually Worry
Inconsistency becomes more concerning when several signals align.
1. Multiple comparable videos fall below baseline
One weak video:
possible noise.
Five consecutive comparable videos:
more meaningful.
2. The median itself is falling
Compare rolling blocks.
For example:
Previous 10-video median: 40K
Current 10-video median: 22K
That is more informative than comparing one 300K winner with one 20K upload.
3. Multiple topic families weaken
If only one series falls:
possibly topic-specific.
If nearly everything falls:
broader diagnosis is warranted.
4. Private Analytics deteriorate together
If your own data shows simultaneous weakening in:
- Impressions
- CTR
- Retention
- Returning viewers
that is much more actionable than raw views alone.
5. The decline persists at matched ages
Do not call a video a failure at:
48 hours
because an older comparison video has:
six months
of accumulated traffic.
Match the age.
When You Should Not Panic
Do not immediately rebuild your strategy because:
- One upload missed
- A viral video was followed by normal performance
- Your latest video has fewer lifetime views than an older one
- One topic had lower demand
- Views moved 2x between adjacent uploads
- Your average is much higher than your median
In our sample, adjacent-video differences of at least:
2x
were extremely common.
Even:
5x
differences occurred in almost three out of ten adjacent comparisons on an equal-channel basis.
Context first.
Diagnosis second.
Changes third.
Stop Trying to Make Every Video Perform the Same
A perfectly flat channel is not necessarily the goal.
Imagine two strategies.
Strategy A
Every video:
20K
22K
19K
21K
20K
Very consistent.
Strategy B
12K
18K
15K
150K
20K
13K
300K
Far more volatile.
Which is better?
There is no answer from consistency alone.
Strategy B may be discovering massive new pockets of audience demand.
The correct objective is not:
eliminate variance.
It is:
raise the baseline while continuing to create intelligent upside.
You want:
- Fewer avoidable failures
- More strong normal videos
- More repeatable outliers
- A rising median
You do not necessarily want every result compressed into one narrow band.
A Better Metric: Baseline + Outlier Rate
Instead of asking:
What is my average view count?
Track two things.
Baseline
Your median comparable-video performance.
Example:
20,000 views.
Outlier rate
How often you exceed:
- 2x baseline
- 3x baseline
- 5x baseline
- 10x baseline
Example:
Median: 20K

2x+ videos: 30%
5x+ videos: 12%
10x+ videos: 5%
Now you understand both:
consistency
and:
upside.
A strong channel can improve by:
- Raising the 20K baseline.
- Increasing the frequency of 5x winners.
- Doing both.
That is a much more useful operating model than chasing one average.
How to Apply This With OverseerOS
Start with the free OverseerOS YouTube Channel Analyzer.
Analyze your own public channel or a competitor.
Use the report to inspect:
- Top videos
- Recent uploads
- Titles
- Thumbnails
- Views
- Video duration
- Publishing patterns
Then separate the channel into:
Normal videos
These establish the performance baseline.
Underperformers
These help identify:
- Weak topics
- Packaging failures
- Audience mismatch
- Repeated strategic misses
Outliers
These reveal:
- Unexpected demand
- Strong packaging
- Broader audience opportunities
- Repeatable formats worth investigating
The goal is not to make every video resemble the biggest winner.
It is to understand:
what moved the video away from normal.
For competitor discovery, OverseerOS Viral Channel Finder can help surface channels with unusually strong videos so you can study outliers rather than simply sorting the internet by subscriber count.
The workflow becomes:
Establish baseline
→
Measure variance
→
Find outliers
→
Compare winners with normal uploads
→
Identify repeated mechanisms
→
Create an original experiment
→
Measure whether the baseline improves
That is how inconsistency becomes useful information.
The 20-Video Consistency Audit
Use this every 10 to 20 meaningful uploads.
Baseline
- Collect 20 comparable videos.
- Keep Shorts and long-form separate.
- Use matched video ages where possible.
- Calculate median views.
- Calculate mean views.
- Compare mean vs median.
Distribution
- Calculate the 25th percentile.
- Calculate the 75th percentile.
- Calculate the 90th percentile.
- Measure P75/P25 spread.
- Identify 2x, 5x, and 10x outliers.
Sequence
- Check the last five comparable videos.
- Do not use a viral outlier as the baseline.
- Look for repeated decline rather than one miss.
- Check whether the next video recovered.
- Compare rolling 10-video medians.
Topic
- Group winners by topic family.
- Group underperformers by topic family.
- Identify repeated audience desires.
- Separate broad-demand winners from one-time events.
Packaging
- Compare title promises.
- Compare thumbnail clarity.
- Check whether weaker videos communicated less value.
- Identify repeatable packaging patterns.
Decision
- Keep normal variance in perspective.
- Investigate genuine multi-video declines.
- Study exceptional winners.
- Test one hypothesis at a time.
- Measure whether the median improves.
How We Analyzed the Data
The study used public YouTube video and channel information captured through OverseerOS research and channel-analysis workflows.
The primary analysis was frozen on:
September 1, 2026 at 07:00 UTC.
A channel qualified when:
- OverseerOS had captured a substantial portion of its latest reported public catalog
- Captured public-video count was within approximately ±20% of the latest reported public count
- At least 20 qualifying mature long-form videos were available
- Videos were longer than three minutes
- Videos were at least 90 days old
- Valid positive public view counts were available
That produced:
1,555 mature long-form videos across 42 channels.
How We Measured Inconsistency
Inside each channel, we calculated:
- 10th percentile views
- 25th percentile views
- Median views
- 75th percentile views
- 90th percentile views
- Mean views
- Maximum views
We then calculated channel-level ratios such as:
Middle-50% spread =
P75
÷
P25
and:
Upper-tail multiple =
P90
÷
Median
We calculated the ratios separately for each channel, then reported the median across channels.
This prevents a channel with more videos from automatically receiving more influence over the headline result.
Consecutive-Upload Analysis
For the video-to-video analysis, we used a tighter age window:
90 to 730 days old
and required at least 15 qualifying videos in that window.
That produced:
40 channels
and:
1,147 adjacent mature-video pairs.
For every consecutive pair:
Fold difference =
Larger view count
÷
Smaller view count
The calculation is symmetric.
A move from 10K to 50K and a move from 50K to 10K both represent a:
5x difference.
This allowed us to measure volatility without pretending every difference represented growth or decline.
Limitations
This is an observational study of public YouTube data.
The channels were not randomly selected from all of YouTube
They entered the OverseerOS research corpus through public channel-analysis and discovery workflows.
The statistics describe this qualified sample.
They are not platform-wide probabilities.
Videos were not measured at identical ages
All primary videos were at least 90 days old, but older uploads had more time to accumulate views.
We therefore repeated the distribution analysis using a much tighter 90-to-365-day video window.
The central variability pattern remained.
For channels you own, fixed-age YouTube Analytics comparisons are preferable.
Channels can change over time
A creator can change:
- Niche
- Format
- Production quality
- Audience
- Host
- Strategy
That can increase historical variance.
Again, the tighter one-year sensitivity test still showed substantial inconsistency.
Public views do not reveal the mechanism
We cannot see a competitor's private:
- Impressions
- CTR
- Audience retention
- Traffic sources
- Returning viewers
- Viewer satisfaction
- Revenue
Those metrics can explain why two videos received different outcomes.
Current subscriber count is not historical subscriber count
The channel-size segmentation uses current observed subscriber bands.
A channel may have been much smaller when an older video was published.
The size comparisons are descriptive, not causal.
An outlier is not necessarily repeatable
A huge video may depend on:
- A news event
- Celebrity interest
- Timing
- External traffic
- An unusual topic
A large multiplier tells you to investigate.
It does not promise the result can be recreated.
Final Verdict
Why are your YouTube views so inconsistent?
Because individual videos can occupy radically different performance levels even within the same channel.
In the OverseerOS study of:
1,555 mature long-form videos across 42 channels
the median channel's middle 50% of videos spanned:
5.04x.
Its:
25th-percentile video was only 0.439x the median.
Its:
75th-percentile video reached 2.315x.
And the:
90th percentile reached 5.10x.
The average was:
2.04x the median
because exceptional winners pulled it upward.
When we examined:
1,147 consecutive-video pairs
the median channel's typical adjacent difference was:
2.81x.
About:
62.5%
of consecutive comparisons differed by at least 2x.
29.5%
differed by at least 5x.
And:
15.9%
differed by at least 10x.
So one video dramatically underperforming your previous upload does not prove your channel is dying.
The previous upload may have been exceptional.
The new one may be normal.
Or the new one may genuinely be weak.
You cannot know until you establish the baseline.
The operating rule is:
Do not judge your channel by its last video. Judge each video against a comparable multi-video baseline, then investigate the outliers on both sides.
Measure the median.
Track whether the median itself is rising or falling.
Separate normal volatility from sustained decline.
Then spend your energy understanding the videos that actually escaped the range.
Analyze any public YouTube channel with OverseerOS and compare its winners, recent uploads, and normal performance before deciding whether a view swing is a problem or simply part of the distribution.
Frequently Asked Questions
Why are my YouTube views so inconsistent?
Different videos can perform very differently even on the same channel. In the OverseerOS study of 1,555 mature long-form videos, the median channel's middle 50% of videos occupied a 5.04x view range.
Is it normal for YouTube views to fluctuate?
Large variation was normal within our qualified sample. Across 1,147 consecutive mature-video pairs, 62.5% differed by at least 2x on an equal-channel basis.
Why did my last YouTube video get lots of views but the new one did not?
The previous video may have been an outlier. Compare both videos with the median performance of 10 to 20 comparable uploads before assuming the channel declined.
Is a 50% drop in YouTube views bad?
Not necessarily. A 50% change can occur inside an already wide channel distribution. Determine whether the new video is below your normal baseline rather than simply below an unusually successful previous upload.
Is a 90% drop in YouTube views possible without the channel dying?
Yes. A 10x breakout followed by a normal 1x upload represents roughly a 90% decline from the breakout even though the second video can still be perfectly normal for the channel.
How much do YouTube views normally vary between videos?
In our consecutive-video analysis, the median channel's typical adjacent pair differed by 2.81x. Almost 30% of adjacent comparisons differed by at least 5x.
How often do consecutive YouTube videos differ by 10x?
In the OverseerOS sample of 1,147 adjacent mature-video pairs, 15.9% differed by at least 10x on an equal-channel basis.
Why does one of my videos get 100K views and the next get 10K?
The 100K video may have reached a broader topic audience, used stronger packaging, benefited from timing, or simply been a major channel-relative outlier. Compare both with your normal baseline before diagnosing the difference.
Does inconsistent YouTube performance mean the algorithm is confused?
Public view inconsistency alone cannot establish anything about the recommendation system. First investigate topic demand, packaging, audience fit, timing, and whether a previous video distorted your expectations.
Is my YouTube channel dying?
One weak upload cannot answer that. A sustained decline across several comparable videos, falling rolling medians, and weakening private Analytics signals provide much stronger evidence than one bad result.
How many videos should I use to calculate my normal YouTube views?
Use at least 10 comparable videos when possible and preferably 20 or more for a stronger baseline. Keep format, channel era, and video age reasonably comparable.
Should I use average or median YouTube views?
Use median views as the primary measure of typical performance. In our sample, the median channel's arithmetic mean was 2.04x its median because large winners pulled the average upward.
Why is my YouTube average much higher than most of my videos?
A small number of breakout videos can heavily distort the arithmetic mean. This is common in winner-driven performance distributions.
How do I calculate my YouTube channel baseline?
Choose 10 to 20 comparable videos, measure them at similar ages where possible, and calculate the median view count. Then compare each video's performance with that median.
How do I know if a YouTube video underperformed?
Calculate:
Relative performance =
Video views
÷
Comparable-video median
A video substantially below 1x is below the chosen baseline. Interpret the result alongside impressions, CTR, retention, topic, and video age.
How do I know if a YouTube video is an outlier?
Compare the video's views with the median of comparable uploads. A 2x result is meaningfully above normal, while 5x or 10x represents increasingly extreme relative performance.
Are smaller YouTube channels more inconsistent?
They were somewhat more volatile in our sample. Channels below 100K current subscribers had a 5.26x median middle-50% spread compared with 4.67x among channels with 100K or more.
Should I change my strategy after one low-view video?
Usually not based on the view count alone. Diagnose the topic, packaging, audience fit, retention, and position relative to your multi-video baseline first.
How many bad YouTube videos should worry me?
There is no universal number, but several comparable uploads declining together are more meaningful than one isolated miss. Track a rolling median rather than reacting to individual videos.
What should I do after a YouTube video goes viral?
Do not automatically make an identical sequel. Determine what audience demand, topic, promise, format, or packaging made the video unusual, then test the transferable mechanism with an original follow-up.
Can OverseerOS help me understand inconsistent YouTube views?
OverseerOS Channel Analysis lets you inspect public top videos, recent uploads, titles, thumbnails, durations, and view patterns for your channel or competitors, helping you separate normal performance from unusual winners and misses.