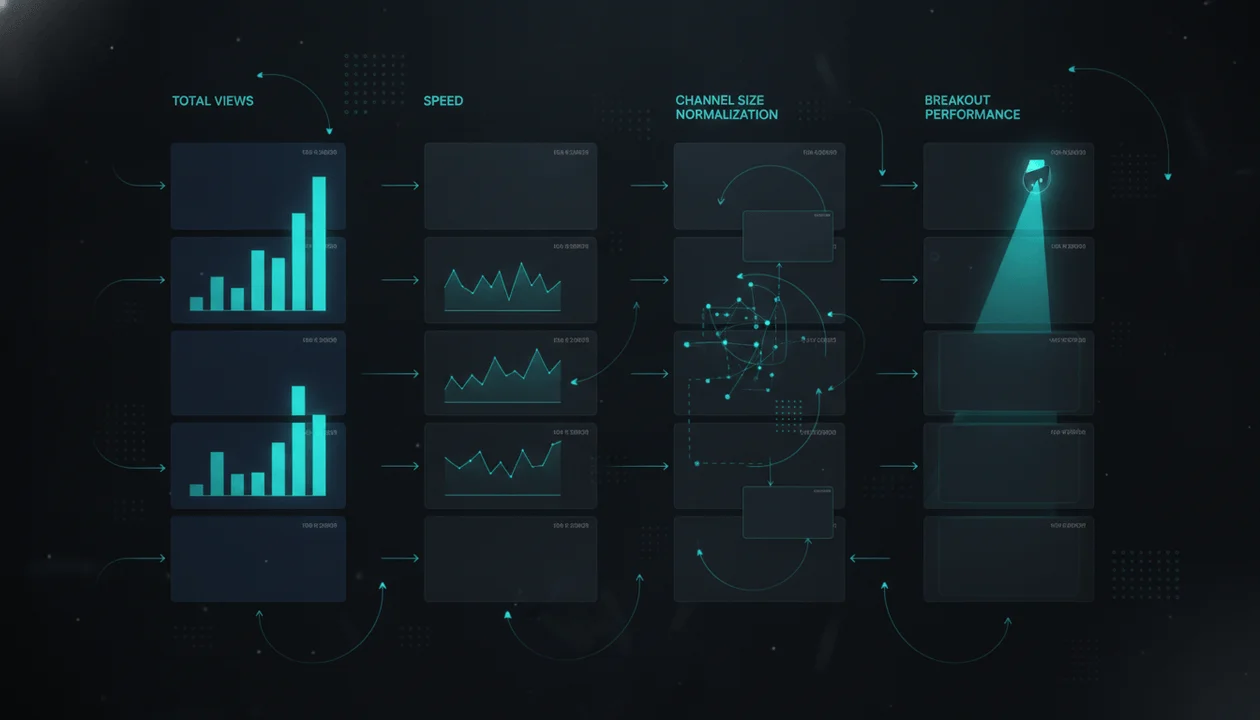
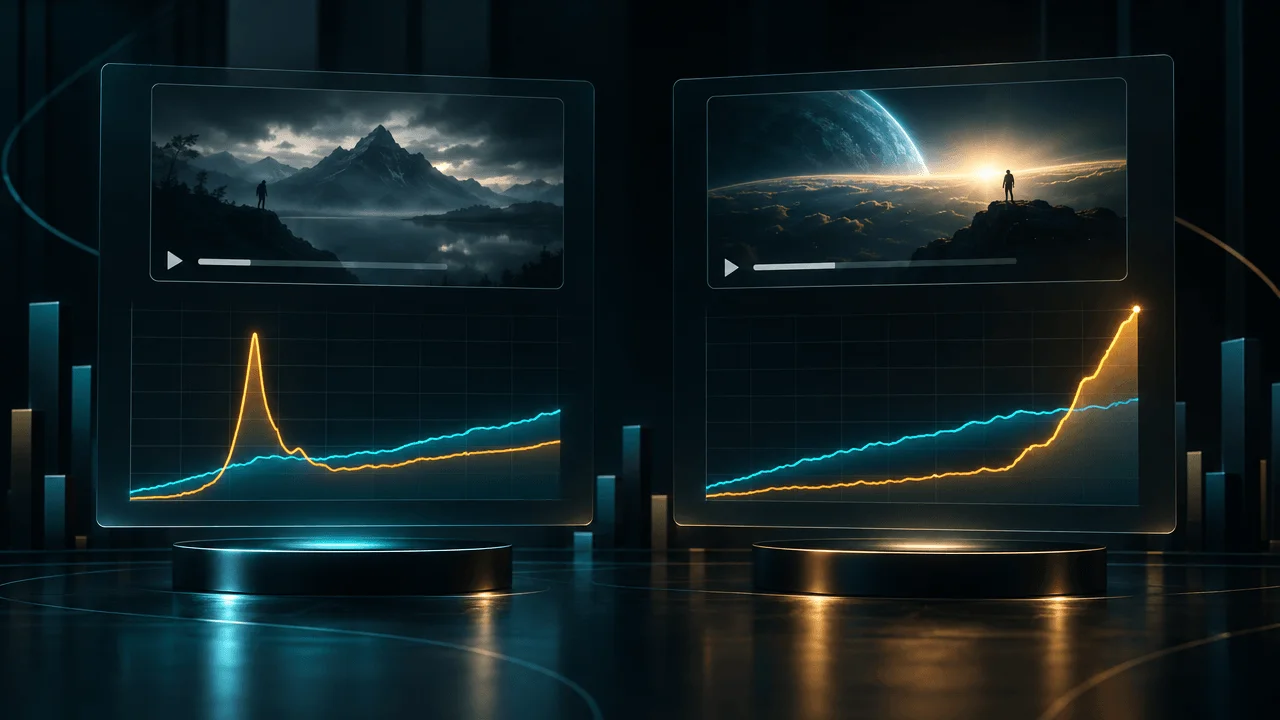
A YouTube video can outperform its channel by 10 times and still be a weaker research opportunity than a video with an 8x outlier score.
That sounds contradictory. It becomes understandable when you examine what the rest of the channel is doing.
On November 5, 2026, OverseerOS analyzed 7,642 qualifying YouTube outliers across 1,048 channels to investigate a question that simple outlier calculators cannot fully answer:
Does a high outlier multiplier mean a video is genuinely exceptional, or is it sometimes reflecting the growth of the entire channel?
The most important finding was that 2,196 videos, or 28.7% of the sample, fell below an additional channel-trend threshold, despite every one of them qualifying as at least a 3x outlier.
Even more interesting, 633 videos with outlier scores of 10x or higher received the same flag.
These were not fake view counts or necessarily bad videos. They were genuine overperformers against their historical channel baselines. But their scores looked less exceptional after accounting for how the channel's other recent videos were performing.
That distinction matters if you use YouTube outliers to choose video ideas, evaluate competitors, or decide which content strategies are worth replicating.
Key Findings
Our analysis produced six findings that change how creators should evaluate YouTube outlier scores.
| Finding | OverseerOS research result | Why it matters |
|---|---|---|
| 1. Historical outliers are not always current standouts | 2,196 of 7,642 videos (28.7%) were channel-trend flagged | The original multiplier does not always describe how exceptional a video is today |
| 2. Even 10x scores need verification | 633 of 3,169 videos scoring at least 10x were flagged (20.0%) | A dramatic multiplier is not sufficient evidence of an unusually strong individual result |
| 3. Lower-multiplier outliers were flagged more often | 41.1% of 3x–under-5x videos were flagged, compared with 17.7% of 20x+ videos | Historical multiplier strength and channel-trend strength are related but distinct |
| 4. Video format changed the pattern | 30.5% of qualifying long-form videos were flagged versus 15.9% of Shorts | Outlier interpretation should account for format and sample composition |
| 5. Channel weighting changes the picture | The average channel had 16.2% of its qualified outliers flagged, versus 28.7% when every video was weighted equally | A few channels with many qualifying videos can disproportionately influence video-level statistics |
| 6. Momentum evidence was often unavailable | Only 3,329 videos (43.6%) had a usable momentum classification | A strong historical multiplier should not automatically be described as accelerating |
These findings come from a curated sample of videos that had already qualified as outliers.
They do not establish the probability of a random YouTube upload going viral, and they do not prove that a trend-flagged video will subsequently underperform.
What they establish is more specific: relying on the historical multiplier alone can produce a materially different research shortlist from applying an additional channel-trend check.
How We Analyzed 7,642 YouTube Outliers
OverseerOS operates a continuously refreshed research system that monitors public YouTube video performance and compares individual videos against their channels' historical results.
For this study, we examined the qualifying outliers held in the OverseerOS research library at 11:45 UTC on November 5, 2026.
Research sample
| Research characteristic | Verified value |
|---|---|
| Videos analyzed | 7,642 |
| Distinct YouTube channels | 1,048 |
| Long-form videos | 6,700 |
| Shorts | 942 |
| Video publication range | July 6 to November 3, 2026 |
| Outlier qualification collection period | October 24 to November 5, 2026 |
| Minimum outlier multiplier | 3x |
| Minimum public video views | 10,000 |
| Minimum historical baseline sample | 10 same-format older uploads |
| Median baseline sample | 35 older uploads |
| Median historical outlier multiplier | 7.65x |
Each video represents one qualifying outlier record, not one row per view-count observation.
We excluded other research classifications, such as early-signal channels that did not have a sufficiently established historical baseline for a comparable outlier multiplier.
How the original multiplier was calculated
For this research cohort, OverseerOS evaluates videos published approximately 2 to 120 days before evaluation.
The historical reference is built from older videos on the same channel and in the same format. The median of that older reference group establishes the baseline.
The basic calculation is:
Historical outlier multiple = Video views / Historical channel median views
For example, a video receiving 150,000 views against a historical median of 15,000 would have a 10x multiple.
This is a ratio calculated independently by OverseerOS, not an official YouTube metric.
A video also needs adequate historical evidence, sufficiently fresh public view readings, and other qualification checks before appearing in the research library.
The second test: channel-trend lift
We then examined a second measurement: how unusual the video's historical multiplier was compared with the channel's other evaluated videos.
The calculation is:
Channel-trend lift = Video's historical multiple / max(1, median multiple of the channel's evaluated videos)
The minimum denominator of 1 prevents a low channel-wide median from artificially inflating this secondary comparison.
For this investigation, a video was flagged when its channel-trend lift was below 2.
In plain English, this identifies videos whose historical multiplier is less than twice the current comparison level established by the channel's evaluated uploads.
It does not mean the video failed to outperform its historical baseline.
Integrity checks
Before interpreting the findings, we checked the qualifying sample against the stored eligibility rules.
The validation found:
- No videos below the 3x historical multiplier threshold.
- No videos below the 10,000-view minimum.
- No videos with fewer than 10 qualifying historical baseline uploads.
- No videos below the required channel-confidence threshold.
- No records outside the permitted video-age window.
- No view readings beyond the allowed freshness tolerance.
The stored channel-trend calculation also matched the independently recomputed formula within the expected rounding tolerance. One record differed when a rounded lift value was compared directly with the threshold; the stored classification itself was based on the unrounded calculation.
These checks support the internal consistency of the sample. They do not eliminate selection bias or prove that a particular content idea will succeed elsewhere.
Finding 1: Nearly 29% of Qualifying Outliers Were Less Exceptional After Adjusting for Channel Trends
2,196 of 7,642 qualifying videos, or 28.7%, were channel-trend flagged.
Every video had already cleared the primary 3x threshold.
The issue was not whether the videos had substantially exceeded their historical channel baselines. They had.
The question was whether they remained particularly unusual relative to the channel's broader recent performance.
Consider two hypothetical channels.
Channel A: A 10x video on a rapidly improving channel
Suppose a channel's historical median is 10,000 views.
Its newer videos have become much more successful, with a median performance of 7x the historical baseline.
One video reaches 100,000 views.
Its historical multiplier is:
100,000 / 10,000 = 10x
But its channel-trend lift is:
10 / 7 = 1.43x
The video is a legitimate 10x historical outlier.
However, relative to the channel's newer performance, it is no longer an exceptionally unusual result.
Channel B: An 8x video on a more stable channel
Now imagine another channel with a historical median of 10,000 views.
Its evaluated videos have a median multiple of 1.4x.
One video reaches 80,000 views.
Its historical multiplier is:
80,000 / 10,000 = 8x
Its channel-trend lift is:
8 / 1.4 = 5.71x
Despite having a lower historical outlier score, this video stands much further above its channel's newer performance level.
| Comparison | Channel A | Channel B |
|---|---|---|
| Historical median views | 10,000 | 10,000 |
| Video views | 100,000 | 80,000 |
| Historical outlier multiple | 10x | 8x |
| Channel's evaluated median multiple | 7x | 1.4x |
| Channel-trend lift | 1.43x | 5.71x |
| Additional trend test | Flagged | Not flagged |
These examples are hypothetical calculations, not individual records from the research dataset.
The practical lesson: The highest historical multiplier is not always the video that most clearly separates itself from its channel's current performance.
Before using an outlier as the basis for a new production, ask whether one video is exceptional or the entire channel has entered a stronger performance period.
Both can be valuable signals, but they suggest different opportunities.
Finding 2: One in Five 10x+ Outliers Was Still Channel-Trend Flagged
Creators frequently use 10x as a shortcut for identifying unusually successful videos.
The logic is understandable. A video receiving ten times a channel's normal views sounds like an extraordinary result.
But our data shows why that number needs context.
Of the 3,169 qualifying videos with a historical multiplier of at least 10x, 633 were channel-trend flagged.
That is 20.0% of the 10x+ group.
Put differently, one in five of the highest-scoring candidates did not clear the additional 2x channel-trend-lift threshold.
This does not invalidate those 633 videos. It changes how they should be interpreted.
A 10x video could represent:
- A single topic attracting significantly more viewers than the channel normally reaches.
- A new content format succeeding across several uploads.
- A channel entering a sustained growth phase.
- A stronger production or packaging strategy affecting many videos.
- A temporary demand event influencing multiple uploads.
A multiplier alone cannot distinguish these explanations.
What about extreme outlier scores?
We also identified 344 channel-trend-flagged videos scoring at least 20x.
Of those, 78 had historical multiples of at least 50x.
These were genuine stored multipliers, not invented examples.
The important distinction is that an extreme ratio may tell you more about the difference between a channel's historical and current performance than about the uniqueness of one particular video.
A 50x score should attract attention.
It should not automatically become your next video idea.
Finding 3: The Smaller the Historical Multiplier, the More Often the Channel-Trend Check Flagged It
We divided the full research sample into four historical-multiplier groups.
| Historical multiplier | Videos analyzed | Trend-flagged videos | Flagged share |
|---|---|---|---|
| 3x to under 5x | 2,383 | 980 | 41.1% |
| 5x to under 10x | 2,090 | 583 | 27.9% |
| 10x to under 20x | 1,228 | 289 | 23.5% |
| 20x or higher | 1,941 | 344 | 17.7% |
| Total | 7,642 | 2,196 | 28.7% |
The pattern is clear within this selected sample.
Videos in the 3x to under-5x group were flagged more frequently than videos with very large historical multipliers.
Among the 20x+ group, fewer than one in five received a trend flag.
This finding needs careful interpretation.
The trend test uses the video's historical multiplier as part of its calculation. Therefore, the relationship between higher multipliers and lower flag frequency is partly structural. It should not be presented as independent proof that higher-scoring videos have better future performance.
Nevertheless, the result is useful for research filtering.
It tells us how materially the shortlist changes when we introduce current channel performance as an additional screen.
What a stricter shortlist would look like
If we held back every trend-flagged video below 10x, while keeping larger flagged outliers visible for further investigation, the result would be:
| Classification | Videos |
|---|---|
| Not channel-trend flagged | 5,446 |
| Flagged, but historical multiple at least 10x | 633 |
| Flagged and historical multiple below 10x | 1,563 |
| Total | 7,642 |
Such a rule would hold back 1,563 videos, or 20.5% of the entire qualifying sample, without claiming they are invalid or permanently removing them from research.
This is a useful distinction between discovering candidates and deciding which candidates deserve immediate attention.
Not every qualifying outlier needs the same priority.
Finding 4: Long-Form Outliers Were Flagged Almost Twice as Often as Shorts
The sample contained 6,700 long-form videos and 942 Shorts.
We analyzed the formats separately because combining them would conceal meaningful differences.
| Video format | Videos | Trend flagged | Flagged share |
|---|---|---|---|
| Long-form | 6,700 | 2,046 | 30.5% |
| Shorts | 942 | 150 | 15.9% |
The trend-flagged share was approximately 1.9 times as high in the long-form group.
That does not prove that long-form outlier scores are inherently less reliable than Shorts scores.
The two groups differ in channel composition, historical upload patterns, video age and available observations. This study did not isolate the independent effect of format after controlling for every one of those factors.
However, it reinforces an important operational rule.
Never assume the same outlier research strategy is equally informative for Shorts and long-form videos.
A creator studying a winning 12-minute documentary should compare it with relevant long-form uploads, not use the channel's Shorts performance as the denominator.
Likewise, a Short with unusually high views should be evaluated against comparable Shorts.
This also matters when researching channels that use Shorts to attract new viewers before publishing longer videos.
The formats may contribute to a shared channel strategy, but their individual outlier signals should remain distinct.
Finding 5: Video-Level Statistics Can Overstate How Widespread a Pattern Is Across Channels
The first headline result was that 28.7% of videos were flagged.
But those 7,642 videos did not come from 7,642 independent creators.
They came from 1,048 channels.
Some channels contributed many qualifying videos. Others contributed only one or two.
That creates an important statistical problem: treating every video equally gives more weight to channels that contribute more outliers.
To investigate, we calculated the flagged share separately for each channel, then averaged those channel-level shares.
The results were different.
| Measurement | Result |
|---|---|
| Video-weighted flagged share | 28.7% |
| Average flagged share when each channel receives equal weight | 16.2% |
| Channels with at least one flagged outlier | 330 of 1,048 |
| Share of channels with at least one flagged outlier | 31.5% |
| Median channel-level flagged share | 0% |
This is one of the most important methodological findings in the study.
The 28.7% result accurately describes the proportion of flagged videos in our qualifying sample.
But it should not be interpreted as the typical channel having 28.7% flagged videos.
When channels receive equal weight, the average is 16.2%.
That difference demonstrates why a large video count is not automatically the same thing as a large independent evidence base.
For creators, the practical implication is straightforward.
If you discover ten viral videos from one channel, you have ten useful video examples.
You do not necessarily have ten independent confirmations of demand.
The channel may have shared audience characteristics, promotion, timing, or production advantages affecting many of those uploads.
Research becomes more convincing when similar patterns succeed across genuinely different channels.
Finding 6: A Strong Outlier Is Not Necessarily an Accelerating Video
Historical outlier strength and present-day momentum are different concepts.
A video can have an enormous lifetime multiplier while its views have mostly stopped growing.
Another video may have a smaller multiplier but be gaining views rapidly.
OverseerOS records a momentum classification only when its observations meet the system's reliability requirements.
In this study:
| Momentum evidence | Videos | Share |
|---|---|---|
| Usable momentum classification available | 3,329 | 43.6% |
| No usable momentum classification recorded | 4,313 | 56.4% |
| Total | 7,642 | 100% |
For more than half the qualifying outliers, the research record did not contain a usable momentum classification at the snapshot time.
That does not mean those videos were stagnant or losing momentum.
It means we should not confidently describe their current momentum using the available classification.
Three questions creators should keep separate
1. Did this video outperform its historical baseline?
That is the historical outlier question.
2. Did this video outperform its channel's other newer videos?
That is the channel-trend question.
3. Is the video currently gaining views faster than before?
That is the momentum question, which requires suitable repeated observations.
These questions can lead to different answers about the same video.
A video can be a historical outlier without being exceptional relative to current channel performance.
A video can also be exceptional relative to both historical and current performance without having sufficient evidence to establish whether it is accelerating.
Combining all three concepts into one vague label such as "viral" discards useful information.
What Makes a YouTube Outlier Worth Studying?
Our findings suggest a practical two-stage process.
First, use a historical outlier multiple to discover videos worth investigating.
Second, evaluate whether the evidence supports the specific decision you want to make.
For example, the decision to save a video for inspiration requires less certainty than the decision to build an expensive documentary series around the same topic.
The five-signal research framework
| Signal | Question to answer | What it helps establish |
|---|---|---|
| Historical outperformance | Did the video significantly beat older comparable uploads? | Whether it deserves initial attention |
| Current channel context | Is the video exceptional relative to the channel's newer performance? | Whether the result may reflect individual outperformance or channel-wide improvement |
| Evidence quality | Is the historical baseline large, relevant and sufficiently comparable? | How much confidence to place in the ratio |
| Current momentum | Do sufficiently recent repeated observations indicate continued growth? | Whether the opportunity is still developing |
| Independent confirmation | Are comparable topics succeeding across other channels? | Whether the idea may have broader relevance beyond one creator |
No single column guarantees a successful video idea.
The advantage comes from combining the signals and understanding what each actually measures.
A useful decision framework
Research immediately: A video shows strong historical performance, clearly stands out from its channel's current level, and addresses a relevant audience problem.
Investigate further: A video has a large historical multiplier but its channel-wide performance has also risen sharply. Determine whether the opportunity is the individual topic or a repeatable change in the channel's strategy.
Monitor rather than commit: A video has an interesting multiplier but weak freshness, limited historical evidence, or insufficient independent confirmation.
These are research recommendations, not validated probabilities of future success.
How to Apply These Findings With OverseerOS
You do not need to calculate every metric manually to build a stronger research process.
The objective is to find promising videos, assess the evidence, and transform what you learn into original content.
Step 1: Find qualifying breakout videos
Open the OverseerOS Viral Outlier Library.
It monitors public YouTube videos and identifies candidates that perform substantially above their own channels' historical baselines.
You can explore opportunities using filters such as niche, age, strength and channel size.
The library also accounts for channel-trend concerns when presenting and prioritizing candidates.
Full library access is available on OverseerOS paid plans, while Free users can preview locked opportunities.
Step 2: Examine the channel behind the video
Do not stop at the video's multiplier.
Use the free OverseerOS YouTube Channel Analyzer to investigate the broader channel.
Look at its other uploads, content strategy, recurring topics and performance patterns.
Try to answer:
- Is this one standout video or part of a broader shift?
- Has the channel recently changed its content format?
- Are multiple newer videos outperforming older uploads?
- Does the channel repeatedly succeed with similar ideas?
A single viral video tells you what happened once.
A channel's broader pattern provides context about what may be repeatable.
Step 3: Separate transferable strategy from non-transferable circumstances
Suppose an educational channel has several breakouts built around surprising scientific discoveries.
The opportunity may not be one particular title.
It might be a repeatable structure:
- An extraordinary but verifiable question.
- A clear promise in the title.
- A thumbnail built around one intriguing visual.
- A script that progressively explains the evidence.
- A recognizable documentary format.
Those are hypotheses to investigate, not conclusions established by the outlier multiplier alone.
OverseerOS Channel Blueprint Cloner and OverseerOS CreatorDNA help creators analyze public channel strategy and turn relevant patterns into original content workflows.
The goal is to learn from the underlying approach without copying someone else's creative work.
Step 4: Save the opportunity and build an original version
Once a promising idea passes your research checks, save it from the OverseerOS Viral Outlier Library to your Content Planner.
Develop a new angle suited to your intended audience.
Then use the relevant OverseerOS scripting, title and thumbnail workflows to turn the research into a production-ready concept.
For additional guidance on interpreting multipliers, read our YouTube Outlier Benchmark Report.
To understand why relying on a channel's all-time biggest hit can be misleading, see our separate YouTube Outlier Trap study.
The research should inform the creative decision, not replace it.
What This Study Does Not Prove
The distinction between observed results and predictions matters.
1. A trend flag is not proof of an unreliable video
The 2x channel-trend-lift threshold is an OverseerOS research rule.
It is not a universal statistical boundary established by YouTube.
A flagged video can still be highly successful, strategically useful, and worthy of further investigation.
The flag identifies a particular relationship between historical and current channel performance.
2. This was a selected outlier sample
Every video in the study had already met strict qualification conditions.
The results therefore describe qualifying videos in the OverseerOS research library, not a random sample of all YouTube uploads.
We cannot infer the platform-wide share of viral videos from these numbers.
3. Historical references were not fully age-matched
The underlying research system compares evaluated videos with older historical uploads using current public view readings.
It does not reconstruct every video's view count at the exact same age, such as day seven.
Older videos may have had substantially longer to accumulate views.
That limitation matters when comparing channels with different publishing histories.
For studies focused specifically on performance at equal video ages, fixed-age historical snapshots would be preferable.
Other research systems, including VideoTrends, describe this distinction in their methodology.
4. Video observations are clustered within channels
Multiple videos from the same channel share characteristics that make them statistically dependent.
We reported both video-weighted and channel-weighted results for that reason.
We have not presented significance tests or causal estimates that assume all 7,642 videos are independent.
5. We did not measure future success after the study date
This is a diagnostic analysis of the available research snapshot.
It is not a prospective experiment demonstrating that unflagged outliers generate better future views, or that copying their topics produces successful videos.
That question would require a separate longitudinal study with pre-defined predictions and subsequent outcomes.
6. Public data cannot reveal every reason a video succeeded
Public YouTube information includes metrics such as views, publication dates and video metadata, as documented in the YouTube Data API.
But public channel research does not reveal another creator's complete private YouTube Analytics.
Impressions, retention, traffic sources and audience behavior may help explain a video's performance, but those private measurements are not established by this study.
The analysis identifies observable patterns. It does not reveal the algorithm's reasons for distributing a particular video.
A Better Way to Choose Your Next YouTube Video
The research leads to a straightforward conclusion.
An outlier multiplier is a starting point for investigation, not a complete measure of opportunity quality.
Historical performance can reveal valuable videos that would otherwise be overlooked.
But the context matters.
Before committing to a topic, use this checklist:
- Confirm that the video substantially outperformed a relevant historical baseline.
- Verify that the comparison uses the same video format.
- Check whether the channel's other newer uploads are also significantly outperforming historical results.
- Inspect the number and quality of videos behind the baseline.
- Distinguish historical success from current momentum.
- Look for independent examples of similar demand across channels.
- Identify which elements of the idea are transferable to your audience.
- Develop an original angle instead of reproducing the source video.
- Evaluate your published result using your own YouTube Studio analytics.
A creator who follows this process may reject some visually impressive outliers.
That is not a disadvantage.
The objective is not to collect the most dramatic numbers.
It is to make better decisions about where to invest research, writing, editing and production effort.
Final Verdict: The Best YouTube Outlier Is Not Always the Highest-Scoring One
The OverseerOS analysis of 7,642 qualifying YouTube outliers across 1,048 channels found that:
- 28.7% were flagged by an additional channel-trend test.
- 20.0% of videos scoring 10x or higher were still flagged.
- The flagged share differed substantially by multiplier range and video format.
- Channel-weighted analysis produced a different perspective from video-weighted counts.
- More than half of qualifying videos lacked a usable momentum classification at the study snapshot.
None of this makes outlier research less useful.
It makes careful outlier research more valuable.
A high multiplier tells you that a video performed unusually well against a historical reference.
A broader channel analysis tells you whether the result is unusual within the channel's current performance environment.
Repeated observations and independent examples can then help determine whether the opportunity deserves further investigation.
Find the breakout. Check the baseline. Examine the wider channel. Verify the pattern. Then build something original.
Explore the OverseerOS Viral Outlier Library to discover qualifying videos, examine the public evidence behind their performance, and turn promising opportunities into a structured content plan.
Frequently Asked Questions
What is a YouTube outlier score?
A YouTube outlier score measures a video's performance relative to a channel baseline. A 5x multiplier typically means the video has five times the views of its comparison baseline. Different tools may use different averages, medians and time windows, so their scores are not always directly interchangeable.
Is a 10x YouTube outlier automatically a good video idea?
No. In the OverseerOS study, 633 of 3,169 qualifying videos with historical multiples of at least 10x were flagged by an additional channel-trend check. A 10x result establishes historical outperformance within the tool's method, not the repeatability or transferability of the underlying idea.
Why can a YouTube video have a high outlier score when the whole channel is growing?
An outlier score can use older uploads as its baseline. If the channel's newer uploads are all performing far above that baseline, individual videos may display large historical multipliers even when they are less exceptional relative to the channel's current performance.
What is channel-trend lift?
In this OverseerOS analysis, channel-trend lift compares a video's historical performance multiple with the median multiple of the channel's evaluated videos, using a minimum denominator of 1. It helps distinguish individual outperformance from a broader period of strong channel performance. It is an independently calculated research metric, not an official YouTube statistic.
What percentage of YouTube outliers are misleading?
There is no verified universal percentage. In the OverseerOS sample, 28.7% of 7,642 qualifying outliers received a channel-trend flag. That does not mean 28.7% were false or misleading. It means they fell below the study's additional threshold relative to current channel performance.
Are YouTube Shorts outlier scores more reliable than long-form scores?
This study cannot establish that. Within the qualifying sample, 15.9% of Shorts were channel-trend flagged compared with 30.5% of long-form videos. Differences in channel selection, video age and publishing behavior may contribute to that result. It should not be interpreted as proof that one format produces inherently more trustworthy outlier scores.
How many videos should a YouTube outlier baseline contain?
The outliers analyzed in this study required at least 10 older same-format uploads, and the median historical baseline contained 35 videos. A larger sample can improve stability, but relevance and comparability still matter. Thirty videos from an outdated channel strategy may provide a less useful reference than a smaller, well-matched group.
Does a YouTube outlier score predict future views?
Not by itself. An outlier score describes past or currently observed performance relative to a baseline. It does not establish future distribution, viewer retention, revenue or the success of a similar video published by another channel.
What is the best way to find YouTube outlier videos?
Use a channel-relative research tool that reveals the performance comparison, not just raw view counts. Examine the video's age, format, historical baseline and current channel context. Then look for independent examples of similar demand before using the idea in your own content strategy.
Can I clone a viral YouTube video that I discover?
You can study public performance patterns and use them to inform an original production. The stronger strategy is to identify the viewer problem, topic structure, presentation approach or unmet demand behind the breakout. Develop your own research, script, visuals and creative execution rather than copying another creator's work.