

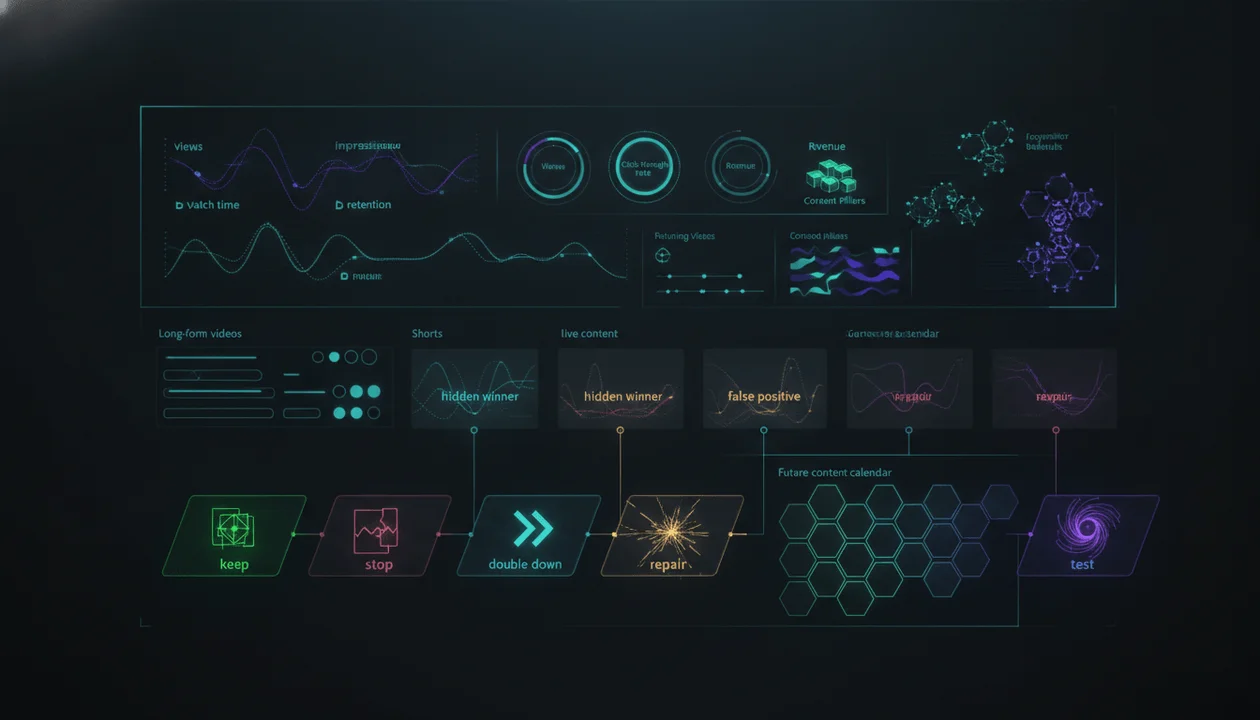
A YouTube channel report should not be a pile of dashboard screenshots.
Screenshots show numbers.
A useful report explains:
- What changed
- Why it changed
- Which videos caused the change
- Which audience behaviors matter
- What the team learned
- What should be repeated
- What should be stopped
- What should be tested next
The difference matters because the same metric can describe completely different situations.
A channel may gain 40 percent more views because:
- One old video suddenly resurfaced
- Shorts output doubled
- A new topic reached a broader audience
- Impressions increased while click-through rate fell
- A viral video created temporary traffic
- Returning viewers grew across several uploads
- Paid promotion created low-quality reach
- The channel published more videos without improving average performance
A basic dashboard may show the increase.
A strong YouTube channel report explains the mechanism behind it.
The best report is therefore not a historical archive.
It is a decision system.
Quick Answer
A YouTube channel report is a structured analysis of a channel’s performance, audience, content, discovery, packaging, retention, business results, and next actions over a defined period.
A complete report should answer five questions:
- What happened?
- Which videos or factors caused it?
- Why did those factors work or fail?
- What did the channel learn?
- What should the team do next?
For a channel you own, YouTube Studio should remain the source of truth for private analytics such as impressions, click-through rate, watch time, audience retention, traffic sources, returning viewers, and revenue.
For a public competitor channel, a report must rely on observable information such as:
- Subscribers
- Public views
- Video count
- Upload history
- Titles
- Thumbnails
- Video duration
- Likes
- Comments
- Views per day
- Breakout performance
- Publishing patterns
- Public engagement ratios
Private competitor metrics cannot be known reliably from public data.
Key Takeaways
- A YouTube channel report should turn analytics into decisions, not merely repeat dashboard numbers.
- YouTube Studio is the source of truth for channels you own or are authorized to manage.
- Public competitor reports cannot access private CTR, retention, traffic sources, demographics, or actual revenue.
- Every report should distinguish measured data, calculated metrics, estimates, and strategic interpretations.
- Views should be analyzed alongside impressions, CTR, watch time, retention, traffic source, audience type, and publishing volume.
- Subscriber count is not the same as active audience size.
- Average performance can be distorted by one viral video, so medians and channel-relative baselines are essential.
- Long-form videos, Shorts, live streams, and podcasts should not be blended into one undifferentiated scorecard.
- The most useful comparison is usually against the channel’s own previous performance and typical video baseline.
- A report should identify winners, underperformers, false positives, and promising videos that lacked sufficient distribution.
- Every insight should lead to a decision, experiment, or content action.
- OverseerOS Channel Pulse can connect to a creator’s own channel and convert private analytics into topic recommendations and video diagnostics.
- OverseerOS AI YouTube Channel Analyzer can create a public-data report for any supported channel URL without claiming access to private YouTube Studio analytics.
- A report has failed when the team finishes reading it and still does not know what to make next.
What Is a YouTube Channel Report?
A YouTube channel report is a structured document or dashboard that explains how a channel performed during a defined period and what the creator should do because of that performance.
It may be created:
- Weekly
- Monthly
- Quarterly
- After a campaign
- After a major upload
- Before a strategy reset
- Before an acquisition
- Before a sponsorship
- Before changing niche
- Before scaling production
A complete report combines four layers.
Layer 1: Measurement
What happened numerically?
Examples:
- Views increased 23 percent.
- Watch time declined 8 percent.
- Four videos were published.
- CTR increased from 4.2 to 5.1 percent.
- Returning viewers grew.
- Revenue per video fell.
- Suggested traffic increased.
Layer 2: Attribution
What caused the result?
Examples:
- Two documentary videos generated most of the watch time.
- A Short created subscriber growth but little long-form viewing.
- The strongest title earned higher CTR.
- A searchable tutorial continued bringing traffic from older uploads.
- One viral video distorted the channel average.
Layer 3: Interpretation
Why did the cause matter?
Examples:
- The audience responded to outcome-led titles.
- Broader topics earned more impressions but lower conversion.
- Longer videos worked only when the opening delivered proof early.
- Search viewers watched deeply but did not return.
- The channel reached new viewers without strengthening audience loyalty.
Layer 4: Decision
What happens next?
Examples:
- Publish two follow-ups to the strongest topic.
- Stop using the weak thumbnail format.
- Repackage three promising videos.
- Create a series around the strongest content pillar.
- Test a shorter opening.
- Reduce production on a low-return format.
- Build the next upload around Suggested traffic.
A report without the final layer is incomplete.
Dashboard vs Report vs Audit
These terms are often used as though they mean the same thing.
They do not.
| Format | Primary Purpose | Typical Output |
|---|---|---|
| Dashboard | Monitor current metrics | Charts, counters, filters |
| Performance report | Explain a specific period | Results, causes, insights, actions |
| Channel audit | Diagnose the channel as a whole | Strengths, weaknesses, opportunities, risks |
| Competitor report | Study another channel’s public strategy | Public patterns, outliers, formats, gaps |
| Executive report | Support business decisions | Priorities, risks, ROI, decisions required |
| Experiment report | Evaluate a controlled test | Hypothesis, result, confidence, next step |
A dashboard answers:
What are the numbers?
A report answers:
What do the numbers mean?
An audit answers:
What is structurally helping or limiting the channel?
The Five Questions Every Channel Report Must Answer
1. What Happened?
State the result clearly.
Example:
Channel views increased 31 percent compared with the previous 28-day period.
Do not begin with interpretation before establishing the result.
2. What Caused It?
Identify the videos, formats, topics, traffic sources, or changes responsible.
Example:
Seventy percent of the growth came from two recent long-form uploads receiving increased Suggested traffic.
3. Why Did It Happen?
Explain the likely mechanism.
Example:
Both videos used the same transformation-led topic format, earned above-baseline CTR, and retained viewers through the first major reveal.
4. What Did We Learn?
Convert the event into a reusable principle.
Example:
This audience responds strongly when a familiar problem is framed through a measurable before-and-after result.
5. What Will We Do Next?
Turn the lesson into execution.
Example:
Produce two adjacent transformation videos, preserve the title structure, and test a more visually specific result in the thumbnail.
This creates a complete reasoning chain:
Result → Cause → Mechanism → Lesson → Action
Types of YouTube Channel Reports
The correct report depends on the question being answered.
Channel Performance Report
Best for:
- Creators
- Channel managers
- Internal teams
- Media companies
Focus:
- Views
- Watch time
- Audience growth
- Video performance
- Discovery
- Retention
- Revenue
- Next actions
Public Competitor Report
Best for:
- Niche research
- Market mapping
- Topic discovery
- Format analysis
- Acquisition research
Focus:
- Public statistics
- Upload frequency
- View distribution
- Breakout videos
- Titles
- Thumbnails
- Video duration
- Engagement
- Recent momentum
YouTube Channel Audit
Best for:
- New clients
- Stalled channels
- Strategy resets
- Pre-acquisition review
- New team onboarding
Focus:
- Positioning
- Audience promise
- Content pillars
- Packaging
- Channel consistency
- Format mix
- Strengths
- Weaknesses
- Opportunities
- Risks
Monthly Creator Report
Best for:
- Solo creators
- Faceless channel operators
- Small production teams
Focus:
- What worked
- What failed
- What to repeat
- What to change
- What to publish next
Agency Client Report
Best for:
- Agencies
- Consultants
- White-label teams
- Channel management services
Focus:
- Work delivered
- Performance
- Competitor movement
- Business impact
- Recommendations
- Client approvals
Agencies building a premium client deliverable should use the more detailed YouTube Client Intelligence Report template.
Campaign Report
Best for:
- Product launches
- Sponsorships
- Paid campaigns
- Event coverage
- Series launches
Focus:
- Campaign objective
- Content output
- Reach
- Engagement
- Conversions
- Cost
- Incremental impact
- Lessons
Executive Business Report
Best for:
- Founders
- Investors
- Publishers
- Media operators
- Channel portfolios
Focus:
- Revenue
- Profitability
- Production efficiency
- Growth quality
- Channel risk
- Resource allocation
- Strategic opportunities
Private Channel Data vs Public Channel Data
One of the biggest reporting mistakes is presenting public estimates as though they were private analytics.
Private Data Available to Authorized Channel Owners
Depending on channel eligibility and data availability, private YouTube analytics can include:
- Impressions
- Impressions click-through rate
- Watch time
- Average view duration
- Average percentage viewed
- Audience retention
- Traffic sources
- YouTube Search terms
- Suggested-video sources
- External sources
- Unique viewers
- New viewers
- Returning viewers
- Casual viewers
- Regular viewers
- Subscriber gains and losses
- Revenue
- Revenue sources
- Geography
- Age and gender data
- Device type
- Playlist performance
- End-screen performance
- Membership data
Publicly Observable Channel Data
A public channel report may use:
- Channel name
- Channel description
- Creation date
- Public subscriber count
- Total channel views
- Public video count
- Published videos
- Upload dates
- Video views
- Likes
- Comments
- Titles
- Descriptions
- Public tags when available
- Video duration
- Thumbnail
- Playlist structure
- Posting frequency
What Public Tools Cannot Reliably Know
A third-party public channel analyzer cannot reliably access another channel’s:
- Private impressions
- Private CTR
- Audience-retention graph
- Average view duration
- Watch time
- Traffic-source mix
- Returning viewers
- Demographics
- Actual RPM
- Actual CPM
- Actual revenue
- Monetization status
- Sponsorship revenue
- Internal recommendation data
These values should never be invented.
The Complete YouTube Channel Report Structure
A world-class report can be organized into thirteen sections.
1. Executive Summary
The executive summary should explain the reporting period in one page or less.
Include:
- Overall performance direction
- Biggest win
- Biggest problem
- Most important lesson
- Highest-priority action
- Decision or approval required
Executive Summary Template
During [PERIOD], the channel generated [RESULT], representing a [CHANGE] compared with [COMPARISON PERIOD].
The strongest growth driver was [VIDEO, TOPIC, FORMAT, OR TRAFFIC SOURCE].
The main constraint was [PROBLEM].
The clearest lesson is [INSIGHT].
During the next period, the channel should prioritize [ACTION].
The most important decision required is [DECISION].
Example
During the last 28 days, channel views increased 24 percent and watch time increased 31 percent.
Most growth came from two long-form videos covering AI workflow experiments. Both earned above-baseline CTR and stronger-than-typical retention.
Shorts generated reach but did not materially increase returning long-form viewers.
The next content cycle should prioritize evidence-led experiments while reducing generic tool-list videos.
2. Channel Goal and Reporting Context
Metrics are meaningless without a goal.
State the channel’s primary objective.
Possible objectives:
- Ad revenue
- Sponsorship revenue
- Leads
- Product sales
- Authority
- Community growth
- Viewer loyalty
- Search traffic
- Brand awareness
- Content-market validation
- Channel acquisition value
Goal-to-Metric Map
| Channel Goal | Primary Metrics |
|---|---|
| Ad revenue | Watch time, monetized views, RPM, revenue per video |
| Sponsorships | Relevant reach, audience fit, repeat viewership, brand-safe topics |
| SaaS leads | Qualified views, clicks, trials, assisted conversions |
| Ecommerce | Product clicks, revenue, conversion, content-assisted sales |
| Authority | Reach within target audience, returning viewers, search visibility |
| Community | Returning, casual and regular viewers, comments, live participation |
| Search growth | Search views, queries, evergreen watch time, long-tail performance |
| Audience growth | Unique viewers, returning viewers, subscriber conversion |
| Media portfolio | Revenue, production cost, margin, risk, scalability |
A report should not celebrate subscriber growth when the business goal is qualified software trials and the subscribers came from unrelated Shorts.
3. Channel Scorecard
The scorecard provides the high-level view.
Recommended Scorecard
| Metric | Current Period | Previous Period | Change | Target | Interpretation |
|---|---|---|---|---|---|
| Videos published | |||||
| Views | |||||
| Watch time | |||||
| Unique viewers | |||||
| Returning viewers | |||||
| Subscribers gained | |||||
| Impressions | |||||
| CTR | |||||
| Average view duration | |||||
| Estimated revenue | |||||
| Website clicks | |||||
| Leads or sales |
Do not include every available metric.
Include the metrics tied to the goal.
4. Publishing and Production Report
Performance depends partly on what the channel published.
Track:
- Videos published
- Shorts published
- Live streams
- Total runtime
- Production cost
- Production time
- Missed uploads
- Delayed videos
- Revision rounds
- Average cost per video
- Average time from idea to publication
Why Production Belongs in the Report
Suppose views increased by 20 percent.
That sounds positive.
But what if the team:
- Published twice as many videos
- Doubled editing costs
- Missed higher-value projects
- Reduced average views per upload
The channel grew.
The production system may have become less efficient.
Publishing Efficiency
A simple internal planning metric is:
Views per published video = Period views attributable to new uploads ÷ Number of new uploads
Another is:
Watch time per production hour = Watch time generated ÷ Production hours
These are internal operating metrics, not official YouTube metrics.
5. Reach and Discovery Report
This section explains how viewers found the channel.
Include:
- Impressions
- CTR
- Views from impressions
- Browse traffic
- Suggested traffic
- Search traffic
- External traffic
- Notifications
- Channel-page traffic
- Shorts feed
- Playlist traffic
- Paid traffic
Discovery Questions
- Did YouTube show the content to more viewers?
- Did viewers choose it when shown?
- Which surfaces created the most valuable views?
- Did traffic quality differ by source?
- Which videos expanded beyond the existing audience?
- Which videos depended on search?
- Which videos entered Suggested traffic?
- Which external sources mattered?
Traffic Source Interpretation
| Signal | Possible Meaning |
|---|---|
| Browse rising | Packaging and broad audience relevance may be improving |
| Suggested rising | Video may connect well with adjacent viewer sessions |
| Search rising | Topic and metadata align with active intent |
| External rising | Distribution outside YouTube is driving discovery |
| Shorts feed rising | Short-form reach is increasing |
| Notifications high | Core audience responded quickly |
| Channel-page traffic high | Viewers are exploring the catalog |
Traffic source explains the nature of the view.
Ten thousand Search views and ten thousand Home views do not represent the same viewer behavior.
6. Packaging Report
Packaging includes:
- Topic
- Title
- Thumbnail
- Timing
- Audience expectation
The report should analyze packaging at the video level.
Packaging Table
| Video | Impressions | CTR | Views | Retention | Diagnosis |
|---|---|---|---|---|---|
| Video A | High | High | High | High | Strong package and delivery |
| Video B | High | Low | Low | Strong | Packaging problem |
| Video C | Low | High | Low | High | Promising, limited distribution |
| Video D | High | High | High | Low | Promise or opening mismatch |
| Video E | Low | Low | Low | Low | Weak idea or execution |
Packaging Diagnostic Matrix
High Impressions + High CTR
The package attracted viewers.
Next question:
Did viewers stay?
High Impressions + Low CTR
Likely packaging weakness.
Investigate:
- Title clarity
- Thumbnail concept
- Topic relevance
- Audience targeting
- Competitive environment
Low Impressions + High CTR
Potential hidden winner.
Possible explanations:
- Narrow audience
- New channel
- Limited recommendation testing
- Strong performance inside a small cohort
- Topic with limited demand
Consider:
- Repackaging
- Follow-up video
- Better internal linking
- Stronger series context
- More time
High CTR + Low Retention
The package won the click, but the video did not fulfill the expectation strongly enough.
Possible causes:
- Slow opening
- Misleading promise
- Wrong audience
- Weak first proof
- Excessive setup
- Format mismatch
Low CTR + Strong Retention
The content may be better than the package.
This is a strong repackaging candidate.
For deeper packaging evaluation, use the YouTube Title Analyzer vs Title Generator guide.
7. Watch Time and Retention Report
Views show entry.
Watch time and retention show consumption.
Track:
- Watch time
- Average view duration
- Average percentage viewed
- First 30-second retention
- Key dips
- Key spikes
- Rewatched moments
- End retention
- Typical retention comparison
- Retention by traffic source when useful
- Retention by new and returning viewers when available
Audience retention is primarily a video-level diagnostic.
Do not summarize the entire channel with one retention number and stop there.
Retention Questions
- Did the opening fulfill the title?
- Where did the first major drop occur?
- Did viewers leave during setup?
- Which examples created spikes?
- Did a CTA interrupt momentum?
- Did the final payoff come too late?
- Did different sources produce different retention?
- Were longer videos earning more total watch time despite lower percentage viewed?
Retention Is Not One Universal Benchmark
A strong retention result depends on:
- Video length
- Format
- Traffic source
- Audience familiarity
- Topic
- Viewer intent
- Channel size
- Content type
Compare videos against:
- Similar length
- Similar format
- Similar traffic source
- Similar audience
- The channel’s own typical performance
8. Audience Report
Subscriber count is a historical total.
It is not the same as active audience.
A stronger audience section includes:
- Monthly audience
- Unique viewers
- New viewers
- Returning viewers
- Casual viewers
- Regular viewers
- Subscribers gained
- Subscribers lost
- Subscriber watch time
- Non-subscriber watch time
- Viewer geography
- Viewer language
- Viewer age and gender when available
- Devices
- When viewers are on YouTube
- Other channels and videos watched
Audience Health Questions
- Is the channel reaching new people?
- Are viewers returning?
- Is the returning audience growing?
- Are new viewers becoming repeat viewers?
- Are subscribers still active?
- Is the audience aligned with the channel’s business?
- Does one format attract viewers who ignore the rest of the catalog?
- Is the channel building a recognizable audience or renting temporary reach?
Reach vs Loyalty Matrix
| New Viewers | Returning Viewers | Interpretation |
|---|---|---|
| High | High | Strong reach and loyalty |
| High | Low | Discovery without durable connection |
| Low | High | Loyal audience but limited expansion |
| Low | Low | Weak reach and weak audience habit |
A channel can grow views while weakening loyalty.
That is why subscriber count alone is not enough.
9. Video Portfolio Report
Do not treat every upload equally.
Classify the catalog.
Winner
A video performs strongly across the metrics tied to the channel’s goal.
Possible signals:
- Above-baseline views
- Strong watch time
- Strong subscriber conversion
- Strong revenue
- Strong returning-viewer contribution
- High-quality leads
- Follow-on viewing
Underperformer
A video performs below the channel’s expected baseline after enough time and distribution.
False Positive
A video looks successful on one metric but weak on the metric that matters.
Examples:
- High views, low qualified conversions
- High CTR, weak watch time
- High subscriber growth from an unrelated topic
- Strong Shorts reach, no long-form audience transfer
- Viral traffic that does not return
Hidden Winner
A video has strong quality signals but limited reach.
Examples:
- High CTR
- Strong retention
- Positive comments
- High subscriber conversion
- Low impressions
Evergreen Asset
A video continues generating meaningful views, watch time, leads, or revenue over a long period.
Report Table
| Video | Role | Evidence | Lesson | Action |
|---|---|---|---|---|
| Video A | Winner | 2.4x typical views, strong retention | Audience wants direct experiments | Produce follow-up |
| Video B | False positive | High views, low conversions | Topic attracted wrong audience | Do not repeat |
| Video C | Hidden winner | Strong CTR and retention, low reach | Package and content are promising | Repackage or extend |
| Video D | Evergreen | Stable Search traffic | Query has durable demand | Refresh and support |
| Video E | Underperformer | Weak CTR and retention | Topic and execution both weak | Stop format |
10. Content Pillar and Format Report
Group videos into meaningful cohorts.
Possible groups:
- Tutorials
- Documentaries
- News
- Reviews
- Comparisons
- Experiments
- Interviews
- Shorts
- Live streams
- Beginner topics
- Advanced topics
- Product-led videos
- Broad entertainment
- Search content
- Browse content
YouTube Advanced Mode allows creators to create groups and compare collections of videos.
This makes it possible to ask:
- Which content pillar creates the most watch time?
- Which format attracts returning viewers?
- Which series converts subscribers?
- Which category earns the strongest revenue?
- Which topics are expensive but weak?
- Which format consistently beats the channel median?
Content Pillar Table
| Pillar | Videos | Median Views | Watch Time | Subscriber Gain | Business Result | Decision |
|---|---|---|---|---|---|---|
| AI experiments | Scale | |||||
| Generic tool lists | Reduce | |||||
| Tutorials | Maintain | |||||
| News | Use selectively |
Medians are especially useful when one viral upload would otherwise distort the group average.
11. Revenue and Business Report
A monetized channel may track:
- Estimated revenue
- Ad revenue
- RPM
- Playback-based CPM
- Revenue by video
- Revenue by geography
- Revenue by content type
- Membership revenue
- Shopping revenue
- Sponsorship revenue
- Affiliate revenue
- Product revenue
- Leads
- Trials
- Sales
Revenue Quality Questions
- Did revenue grow faster than views?
- Which videos earn the highest revenue per view?
- Which topics attract valuable audiences?
- Are sponsorship-safe videos growing?
- Which content supports sales?
- Does the channel depend on one viral video?
- Is revenue diversified?
- Is production cost increasing faster than revenue?
Public Revenue Estimates
Public channel-report tools sometimes estimate revenue from public views and assumed RPM or CPM ranges.
These estimates should be labeled clearly.
They do not reveal:
- Whether the channel is monetized
- Actual RPM
- Viewer geography
- Ad suitability
- Revenue share
- Sponsorship income
- Membership income
- Private views
- Business conversions
Public revenue estimates are directional scenarios, not verified earnings.
12. Competitor and Market Report
Your channel’s performance does not exist in isolation.
A competitor section can include:
- New competitor uploads
- Breakout videos
- Rising channels
- Emerging topics
- Changing title patterns
- New thumbnail styles
- Format shifts
- Publishing frequency
- Video-length changes
- Audience questions
- Content gaps
Competitor Report Questions
- Which competitors accelerated?
- Which topics are spreading?
- Which videos broke above channel baseline?
- Is the market moving toward a new format?
- Which successful angle has not been covered by our channel?
- Which repeated topic is becoming saturated?
- Which small channel is showing early momentum?
- What should we respond to quickly?
- What should we ignore?
The objective is not to copy competitors.
It is to understand where audience attention is moving and create an original response.
13. Decisions, Experiments, and Next Actions
This is the most important section.
Every major insight should become one of five actions.
Keep
Continue a working practice.
Example:
Keep using result-led experiment titles.
Stop
Remove a weak practice.
Example:
Stop publishing generic news summaries without original testing.
Double Down
Increase investment in a proven direction.
Example:
Produce a three-video series around the strongest AI workflow format.
Repair
Improve an underperforming asset.
Example:
Repackage the tutorial with a clearer outcome and more specific thumbnail.
Test
Run a controlled experiment.
Example:
Test a shorter opening that reveals the result before explaining the setup.
Action Table
| Priority | Action | Evidence | Owner | Deadline | Success Metric |
|---|---|---|---|---|---|
| 1 | Publish follow-up to winner | 2.4x median views | Strategist | Watch time | |
| 2 | Repackage hidden winner | Strong CTR and retention | Designer | Impressions and views | |
| 3 | Shorten opening | Early retention drop | Writer | First 30 seconds | |
| 4 | Reduce weak pillar | Low median and conversion | Channel lead | Production efficiency |
A report should not end with vague recommendations such as:
- Make better content
- Improve thumbnails
- Post consistently
- Increase engagement
The action must be specific enough to assign.
The Best Reporting Time Windows
One time window cannot answer every question.
Last 7 Days
Best for:
- Operational monitoring
- New uploads
- Campaigns
- Breaking news channels
- Fast trend response
Risk:
- Results may be unstable.
Last 28 Days
Best for:
- Standard monthly reporting
- Current channel direction
- Audience and performance movement
Last 90 Days
Best for:
- Strategic trends
- Content pillar comparison
- Audience development
- Reducing short-term volatility
Year to Date
Best for:
- Business performance
- Revenue
- Portfolio review
- Seasonal context
Lifetime
Best for:
- Historical top videos
- Evergreen assets
- Catalog concentration
- Long-term channel development
Risk:
- Old strategy may dominate the numbers.
Publish-Age Cohorts
Compare videos at the same age.
Examples:
- First 24 hours
- First 7 days
- First 28 days
- First 90 days
This prevents an old video from being compared unfairly with a new upload.
The Correct Comparison Hierarchy
Use this order.
1. Compare Against the Channel’s Own Baseline
The most relevant benchmark is usually the channel’s normal performance.
2. Compare Similar Videos
Match:
- Format
- Length
- Topic
- Traffic source
- Publish age
- Audience intent
3. Compare the Previous Period
Useful for understanding momentum.
4. Compare the Same Seasonal Period
Useful for seasonal topics and annual cycles.
5. Compare Competitors Carefully
Competitor public data lacks private context.
Use it for market patterns, not exact performance diagnosis.
Average vs Median
Suppose five videos receive:
- 10,000 views
- 12,000 views
- 13,000 views
- 15,000 views
- 500,000 views
Average views:
110,000
Median views:
13,000
The average makes 110,000 views look typical.
It is not.
The viral outlier distorted the result.
A strong report should often include:
- Average
- Median
- Maximum
- Minimum
- Percentile ranges
- Outlier multiple
Channel-Relative Outlier Score
A simple internal metric is:
Outlier multiple = Video views ÷ Channel median views for comparable videos
Example:
- Video views: 120,000
- Comparable-channel median: 30,000
- Outlier multiple: 4x
This is more useful than treating 120,000 views as universally high or low.
The comparison set should be relevant.
Do not compare:
- Shorts with long-form
- New uploads with five-year-old videos
- Tutorials with breaking news
- Paid campaigns with organic videos
Useful Internal Reporting Metrics
The following are planning metrics, not official YouTube metrics.
Subscriber Conversion
Subscribers gained ÷ Views × 1,000
This estimates subscribers gained per 1,000 views.
Watch Efficiency
Watch time ÷ Views
This is closely related to average view duration but can be used at grouped reporting levels.
Publishing Efficiency
Goal outcome ÷ Number of videos published
The outcome may be:
- Watch time
- Revenue
- Leads
- Qualified views
- Subscribers
Revenue per Video
Total channel-attributed revenue ÷ Videos published
Production Return
Business value generated ÷ Production cost
Breakout Rate
Number of videos above defined outlier threshold ÷ Videos published
Define the threshold before calculating it.
The YouTube Channel Health Matrix
Use this matrix to convert metric combinations into diagnoses.
| Reach | CTR | Retention | Likely Diagnosis |
|---|---|---|---|
| High | High | High | Strong topic, package, and delivery |
| High | High | Low | Promise or opening problem |
| High | Low | High | Weak packaging |
| High | Low | Low | Weak package and content fit |
| Low | High | High | Hidden winner or narrow demand |
| Low | High | Low | Package works inside small sample, delivery weak |
| Low | Low | High | Content may be useful but poorly positioned |
| Low | Low | Low | Rebuild topic and execution |
This matrix creates hypotheses.
It does not prove causation by itself.
Reporting Long-Form, Shorts, and Live Separately
Blending formats can hide the truth.
Long-Form Report
Focus on:
- Impressions
- CTR
- Watch time
- Average view duration
- Retention
- Suggested traffic
- Browse traffic
- Search
- Returning viewers
- Revenue
Shorts Report
Focus on:
- Shorts feed reach
- Engaged views
- Stayed to watch
- Average view duration
- Average percentage viewed
- Rewatches
- Subscribers
- Audience transfer
- Follow-on long-form behavior
Live Report
Focus on:
- Peak concurrent viewers
- Average concurrent viewers
- Watch time
- Chat activity
- Replay performance
- Subscriber conversion
- Revenue
- Returning audience
Podcast Report
Focus on:
- Long-session watch time
- Returning viewers
- Episode completion
- Playlist behavior
- Audio-platform impact
- Clip-to-episode movement
A channel with mixed formats should maintain a separate scorecard for each.
How to Create a YouTube Channel Report Manually
Step 1: Define the Goal
Choose the business or audience result that matters.
Step 2: Choose the Period
Use:
- 7 days
- 28 days
- 90 days
- Quarter
- Year to date
Step 3: Establish Comparisons
Compare against:
- Previous period
- Typical performance
- Similar videos
- Target
- Relevant season
Step 4: Export the Data
YouTube Studio Advanced Mode supports deeper filtering, comparisons, groups, saved views, and data export on desktop.
Useful exports include:
- Video performance
- Traffic sources
- Geography
- Subscription status
- Content groups
- Revenue
- Search terms
- Device type
For a deeper walkthrough, read YouTube Advanced Mode: Essential Analytics Reports.
Step 5: Separate Formats
Create separate tabs for:
- Long-form
- Shorts
- Live
- Podcasts
Step 6: Calculate Baselines
Calculate:
- Median views
- Median CTR
- Median retention
- Median watch time
- Median subscriber conversion
- Top quartile
- Bottom quartile
Step 7: Classify Every Important Video
Mark:
- Winner
- Underperformer
- Hidden winner
- False positive
- Evergreen asset
Step 8: Review Packaging
Analyze:
- Topic
- Title
- Thumbnail
- CTR
- Audience expectation
Step 9: Review Delivery
Analyze:
- Opening
- Retention
- Pacing
- Proof
- Payoff
Step 10: Review Audience Quality
Analyze:
- New viewers
- Returning viewers
- Regular viewers
- Subscriber conversion
- Business fit
Step 11: Add Competitor Context
Review:
- Breakout videos
- Emerging topics
- Rising channels
- Format changes
- Content gaps
Step 12: Write the Decision Summary
Limit the next period to a small number of priorities.
Three strong actions are better than twenty vague recommendations.
The Complete Copy-and-Paste Channel Report Template
Reporting Period
- Current period:
- Comparison period:
- Channel goal:
- Primary KPI:
- Videos published:
- Report owner:
Executive Summary
- Overall direction:
- Biggest win:
- Biggest constraint:
- Most important lesson:
- Highest-priority action:
- Decision required:
Channel Scorecard
- Views:
- Watch time:
- Impressions:
- CTR:
- Average view duration:
- Average percentage viewed:
- Unique viewers:
- Returning viewers:
- Subscribers gained:
- Subscribers lost:
- Estimated revenue:
- Business conversions:
Production
- Long-form videos:
- Shorts:
- Live streams:
- Total production cost:
- Average cost per video:
- Average production time:
- Missed or delayed uploads:
- Main production bottleneck:
Discovery
- Browse:
- Suggested:
- Search:
- External:
- Notifications:
- Shorts feed:
- Main discovery change:
- Best discovery opportunity:
Packaging
- Highest-CTR video:
- Lowest-CTR high-impression video:
- Best title pattern:
- Best thumbnail pattern:
- Repackaging candidates:
- Packaging lesson:
Retention
- Best opening:
- Weakest opening:
- Largest recurring dip:
- Strongest recurring spike:
- Best long-form retention:
- Main delivery lesson:
Audience
- New viewers:
- Returning viewers:
- Casual viewers:
- Regular viewers:
- Subscriber conversion:
- Strongest geography:
- Audience-quality concern:
- Audience opportunity:
Video Portfolio
- Winners:
- Underperformers:
- False positives:
- Hidden winners:
- Evergreen assets:
- Follow-up opportunities:
Content Pillars
- Strongest pillar:
- Weakest pillar:
- Highest-value format:
- Most efficient format:
- Format to scale:
- Format to reduce:
Revenue and Business
- YouTube revenue:
- Sponsorship revenue:
- Affiliate revenue:
- Product revenue:
- Leads:
- Trials:
- Sales:
- Production cost:
- Profit contribution:
- Business lesson:
Competitor Intelligence
- Fastest-rising competitor:
- Breakout competitor videos:
- Emerging topics:
- New packaging pattern:
- Content gap:
- Topic requiring fast response:
Decisions
Keep
Stop
Double Down
Repair
Test
Next-Period Action Plan
| Priority | Action | Owner | Deadline | Success Metric |
|---|---|---|---|---|
| 1 | ||||
| 2 | ||||
| 3 |
YouTube Channel Report Tool Landscape
| Tool | Best For | Main Strength | Important Limitation |
|---|---|---|---|
| YouTube Studio | Owners and authorized managers | Source of truth for private channel analytics | Does not provide full public competitor intelligence |
| YouTube Analytics API | Custom authorized reports | Targeted analytics queries, filters, and automation | Requires development and OAuth |
| YouTube Reporting API | Bulk recurring reporting | Large scheduled datasets and report automation | More technical setup |
| vidIQ Channel Audit | Creator-facing channel diagnosis | Channel statistics, content performance, and audit workflow | Recommendations still require creator judgment |
| TubeBuddy Health Report | Simplified channel overview | Consolidated health and performance reporting | Proprietary scores are not guarantees |
| AgencyAnalytics | Agency client reporting | White-label reports and multi-platform dashboards | Primarily reporting, not complete YouTube content strategy |
| Social Blade | Public channel tracking | Public growth history and cross-channel comparison | Revenue and growth projections are estimates |
| OverseerOS AI YouTube Channel Analyzer | Public channel intelligence | Turns public channel signals into deeper creative workflows | Cannot access private competitor analytics |
| OverseerOS Channel Pulse | Own-channel strategy | Converts connected analytics into topics and video diagnostics | Requires authorized channel connection and enough data |
How OverseerOS Supports Channel Reporting
OverseerOS separates two important reporting jobs.
Analyze a Public Channel With OverseerOS AI YouTube Channel Analyzer
OverseerOS AI YouTube Channel Analyzer begins from a supported YouTube channel URL.
It can collect public channel information such as:
- Channel name
- Description
- Thumbnail
- Banner
- Creation date
- Subscribers
- Total views
- Video count
- Public metadata
It can then analyze the public video catalog for signals such as:
- Top-performing videos
- Recent uploads
- Average views
- Median views
- View ranges
- Percentile distribution
- Engagement ratios
- Upload schedule
- Views-per-day estimates
- Breakout signals
- Revenue scenarios based on public views and assumptions
For very large channels, video-level analysis may use smart sampling so the workflow remains practical.
Official channel-level statistics remain grounded in public channel data.
The report can then become the foundation for:
- OverseerOS Channel Blueprint Cloner
- OverseerOS Creator DNA
- OverseerOS Viral Title Architect
- OverseerOS Hook Library
- OverseerOS Script Studio
- OverseerOS Content Planner
- Competitor research
OverseerOS does not claim that this public analysis reveals another creator’s private CTR, retention, audience data, or real revenue.
Analyze Your Own Channel With OverseerOS Channel Pulse
OverseerOS Channel Pulse connects to an authorized creator channel using read-only permissions.
Depending on availability, the workflow can use:
- Channel statistics
- Recent uploads
- Video views
- Watch time
- Average view duration
- Average percentage viewed
- Impressions
- CTR
- Traffic sources
- Retention
- Subscribers gained and lost
- Likes
- Comments
- Shares
- Video duration
OverseerOS Channel Pulse studies up to 100 recent uploads and compares performance against the channel’s own baselines.
It can identify:
- Recent winners
- Views multipliers
- CTR multipliers
- Retention multipliers
- Packaging failures
- Hook failures
- Topic mismatches
- Strong all-round videos
- Recommendation momentum
Instead of stopping at the diagnosis, it can generate:
Ride the Wave Topics
Ideas that extend formats, titles, or audience demand already working on the channel.
Fresh Angles
Adjacent topics the same audience may care about but the channel has not already covered.
Video Autopsies
Diagnostics explaining whether a video likely struggled because of:
- Packaging
- Hook
- Topic demand
- Broader execution
This turns the report into a next-video system.
Add Public Competitor Movement
Use OverseerOS YouTube Competitor Analysis Tool and OverseerOS Overseer Feed to monitor:
- Competitor uploads
- Recent performance
- Velocity
- Breakout videos
- Topic movement
- Emerging formats
Diagnose Important Videos
Use OverseerOS Viral X-Ray to study individual public videos more deeply.
The workflow can help analyze:
- Title
- Thumbnail psychology
- Hook
- Audience
- Emotional framing
- Structure
- Public performance
- Extracted outline
Convert the Report Into Production
The final report should update:
- OverseerOS Content Planner
- Topic priorities
- Follow-up ideas
- Title tests
- Script briefs
- Production notes
- Competitor references
The complete workflow becomes:
Private performance data + public market intelligence → diagnosis → decisions → topics → scripts → production → new data.
Common Reporting Mistakes
Mistake 1: Sending Screenshots Without Interpretation
The reader can already see the dashboard.
Explain what caused the result.
Mistake 2: Reporting Every Metric
More metrics do not create more insight.
Track what matters to the goal.
Mistake 3: Celebrating Views Without Understanding the Source
A view from Shorts, Search, Suggested, paid promotion, and an existing subscriber may have different strategic value.
Mistake 4: Using Subscriber Count as the Audience
Subscribers are not the same as active viewers.
Review unique, returning, casual, and regular viewers.
Mistake 5: Blending Shorts and Long-Form
Different formats have different discovery and consumption patterns.
Report them separately.
Mistake 6: Comparing New Videos With Lifetime Winners
Use publish-age cohorts and comparable formats.
Mistake 7: Relying Only on Averages
One viral video can distort the average.
Include medians and distributions.
Mistake 8: Calling Every High-View Video a Winner
A video may bring the wrong audience, weak retention, low revenue, or no conversions.
Mistake 9: Calling Every Low-View Video a Failure
Strong CTR and retention with low impressions may indicate a promising hidden winner.
Mistake 10: Treating Correlation as Proof
A new title style and higher views may occur together without proving the title caused the growth.
Use repeated patterns and controlled tests.
Mistake 11: Presenting Estimates as Private Data
Label public revenue estimates and inferred metrics clearly.
Mistake 12: Using Universal Benchmarks
A “good” CTR or retention level depends on the channel, format, audience, traffic source, and topic.
Use channel-relative comparisons.
Mistake 13: Ignoring Production Cost
A channel can grow views while becoming less profitable.
Mistake 14: Ignoring Competitor Movement
Performance may be influenced by broader market changes.
Mistake 15: Ending Without Actions
Every report should produce a prioritized next-period plan.
Channel Report Quality Checklist
Data Integrity
- The reporting period is clear.
- The comparison period is appropriate.
- Private and public data are separated.
- Estimates are labeled.
- Shorts, long-form, and live are separated.
- Medians are included where outliers distort averages.
- New videos are compared at equivalent ages.
Analysis
- The report identifies what changed.
- Major changes are attributed to specific videos or sources.
- Packaging and retention are analyzed separately.
- Audience quality is reviewed.
- Winners and false positives are distinguished.
- Competitor context is included where useful.
- Uncertainty is stated clearly.
Decisions
- Every major insight has an action.
- Actions are prioritized.
- Owners are assigned.
- Deadlines are included.
- Success metrics are defined.
- The content plan is updated.
Final Verdict
A YouTube channel report should not be judged by how many charts it contains.
It should be judged by whether it improves the next decision.
A strong report explains:
- What happened
- Which videos caused it
- Why those videos worked or failed
- Which audience behavior changed
- Which content pillar deserves more investment
- Which packaging needs repair
- Which videos should be repeated
- Which formats should be stopped
- Which competitor signals matter
- What the team should publish next
YouTube Studio provides the strongest private analytics for a channel you own.
Public channel analyzers provide market and competitor context.
The most powerful report combines both without pretending they are the same type of data.
The complete system is:
- Define the channel goal.
- Choose the correct reporting period.
- Separate formats.
- Establish channel-relative baselines.
- Identify winners, underperformers, false positives, and hidden winners.
- Diagnose discovery, packaging, retention, and audience quality.
- Add competitor and market context.
- Convert every insight into an action.
- Update the content plan.
- Measure whether the next cycle improved.
The report is not the end of the analytics process.
It is the beginning of the next content decision.
FAQ
What is a YouTube channel report?
A YouTube channel report is a structured analysis of a channel’s performance, videos, audience, discovery, packaging, retention, revenue, and next actions during a defined period.
What should a YouTube channel report include?
It should include an executive summary, goal, KPI scorecard, publishing output, discovery, packaging, retention, audience, video portfolio, content pillars, revenue, competitor intelligence, experiments, and next actions.
What is the difference between a YouTube dashboard and a channel report?
A dashboard displays metrics. A report interprets those metrics, explains the likely causes, and recommends actions.
What is the difference between a channel report and channel audit?
A channel report focuses on performance during a period. A channel audit evaluates the channel’s broader strategy, positioning, content, packaging, and structural health.
How often should I create a YouTube channel report?
A 28-day or monthly report is the best default for most channels. Weekly reports help fast-moving channels, while quarterly reports support larger strategy decisions.
What is the best reporting period for YouTube?
Use seven days for operations, 28 days for monthly performance, 90 days for strategic patterns, and year-to-date for business results.
Which YouTube metrics matter most?
The most important metrics depend on the goal. Common metrics include views, watch time, impressions, CTR, average view duration, retention, unique viewers, returning viewers, subscribers, revenue, and conversions.
Is subscriber count a good measure of channel health?
Subscriber count shows historical channel popularity but does not represent the complete active audience. Monthly audience, unique viewers, returning viewers, casual viewers, and regular viewers provide additional context.
What is a good YouTube CTR?
There is no universal CTR that is good for every channel. CTR varies by traffic source, audience, topic, video, channel size, and how widely YouTube distributes the content.
What is a good audience-retention rate?
Retention depends on video length, format, traffic source, audience, and topic. Compare the video with similar videos and the channel’s typical retention.
Should Shorts and long-form videos be reported together?
They can appear in one executive summary, but their detailed metrics should be analyzed separately because their discovery and consumption patterns differ.
How do I compare YouTube videos fairly?
Compare videos with similar formats, lengths, topics, traffic sources, and publish ages. First-seven-day or first-28-day cohorts are often more useful than lifetime comparisons.
Why should a YouTube report use median views?
Median views reduce the distortion caused by one unusually successful viral video and provide a clearer picture of typical channel performance.
What is a YouTube outlier video?
An outlier is a video performing significantly above a relevant channel baseline. The baseline should account for comparable format, age, and content type.
What is a hidden winner?
A hidden winner is a video with strong quality signals such as CTR, retention, subscriber conversion, or viewer satisfaction but limited impressions or reach.
What is a false-positive YouTube winner?
A false positive looks successful on one surface metric, such as views, but fails to support the channel’s real goal, audience quality, revenue, retention, or conversions.
Can I create a YouTube channel report in YouTube Studio?
Yes. YouTube Studio provides channel analytics, and Advanced Mode supports filters, comparisons, groups, saved views, and exports for deeper reporting.
Can I automate a YouTube channel report?
Yes. Authorized reporting can be automated through the YouTube Analytics API, YouTube Reporting API, reporting platforms, spreadsheets, or specialized creator tools.
What is the YouTube Analytics API?
The YouTube Analytics API supports authorized, targeted queries for channel and content-owner analytics using dimensions, metrics, filters, dates, and sorting.
What is the YouTube Reporting API?
The YouTube Reporting API is designed for recurring bulk analytics reports and larger reporting workflows.
Can a public channel-report tool see competitor CTR?
No. A public tool cannot reliably access another creator’s private impressions click-through rate.
Can a public report see competitor retention?
No. Audience-retention data is private to authorized channel users.
Can a public tool know a competitor’s revenue?
No. It can only create estimates from public views and assumptions. Actual revenue depends on private factors.
Can Social Blade show real YouTube revenue?
Social Blade displays estimated earnings based on public statistics and assumptions. It does not reveal a creator’s verified private earnings.
What does a vidIQ Channel Audit do?
vidIQ Channel Audit analyzes channel statistics, content performance, and engagement to provide a creator-facing audit and recommendations.
What is TubeBuddy Health Report?
TubeBuddy Health Report provides a simplified overview of channel performance and analytics for connected creators.
What is OverseerOS AI YouTube Channel Analyzer?
OverseerOS AI YouTube Channel Analyzer studies public channel information, video performance distribution, upload behavior, engagement, top videos, recent uploads, breakout signals, and estimated revenue ranges.
Does OverseerOS access private competitor analytics?
No. OverseerOS does not claim access to another channel’s private YouTube Studio analytics, retention, CTR, audience data, or real earnings.
What is OverseerOS Channel Pulse?
OverseerOS Channel Pulse connects to an authorized creator’s own channel and turns private analytics into performance insights, video diagnostics, Ride the Wave topics, and Fresh Angle recommendations.
Can OverseerOS explain why a video failed?
OverseerOS Channel Pulse can compare videos against channel baselines and identify possible packaging failure, hook failure, topic mismatch, strong performance, or pending analysis.
How should a YouTube channel report end?
It should end with a prioritized action plan containing the action, supporting evidence, owner, deadline, and success metric.
What is the biggest mistake in YouTube reporting?
The biggest mistake is presenting numbers without decisions. A good report must change what the creator does next.


